
![[Grasshopper] How to use Vector Display to visualize vectors](https://iarchway.com/wp-content/uploads/2025/09/Vector-Display.png)
This article explains how to use Vector Display to visualize vectors.
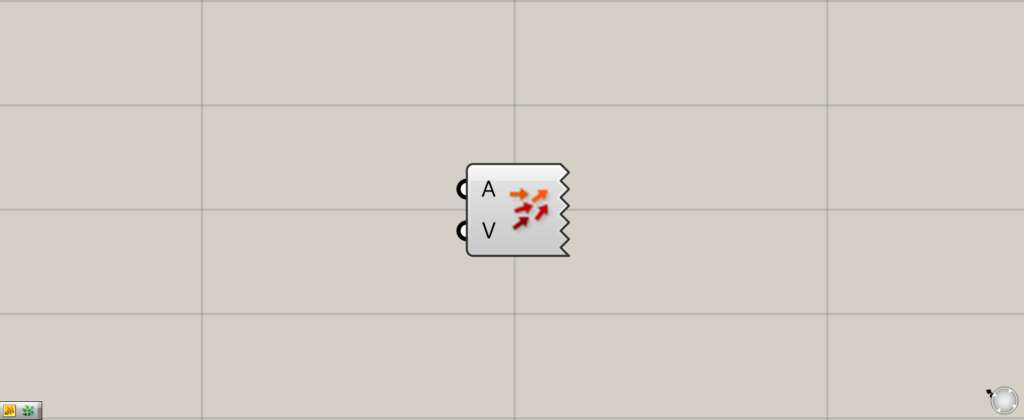
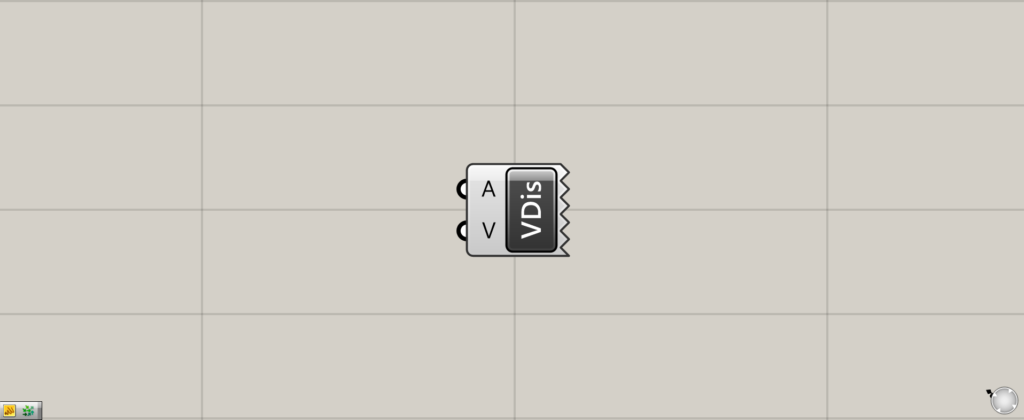
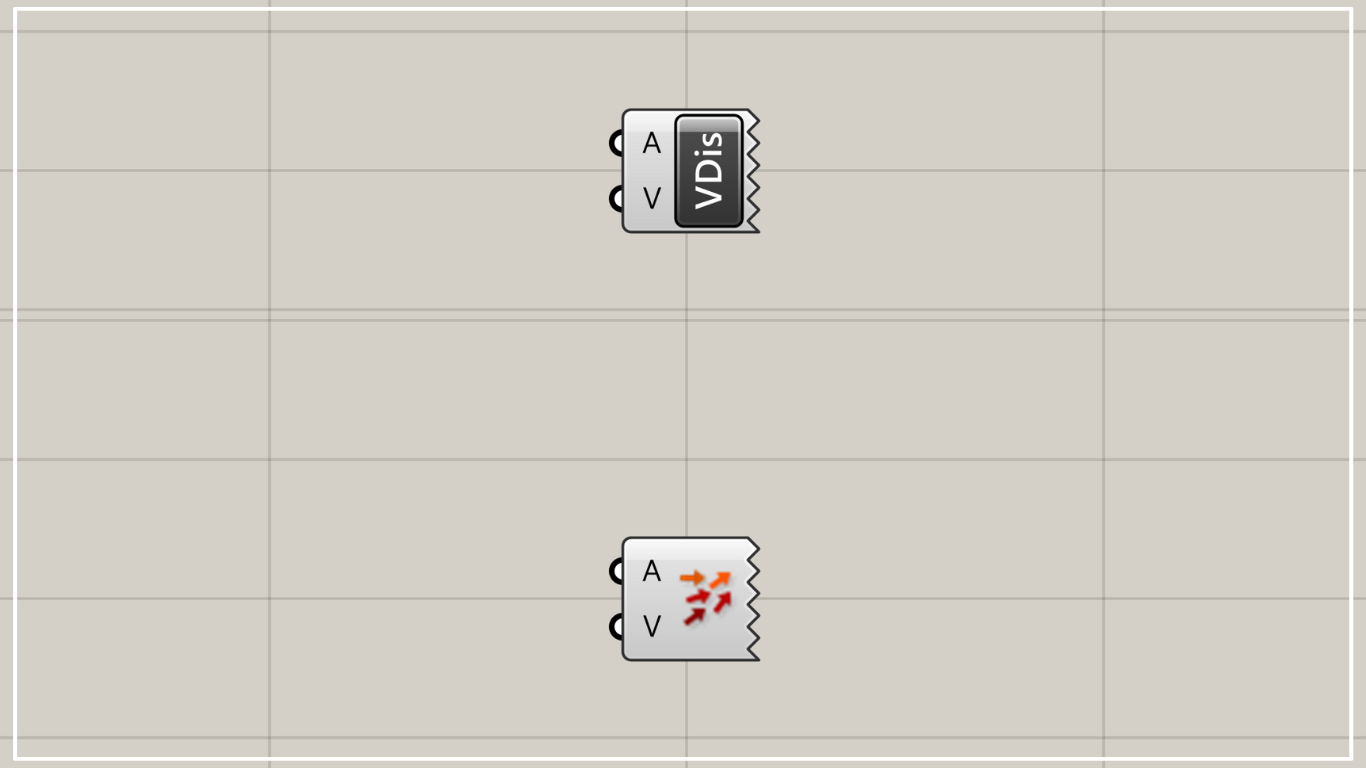
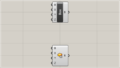
On the Grasshopper, it is represented by either of the two above.
Visualizing Vectors
Vectors can be visualized by using Vector Display.
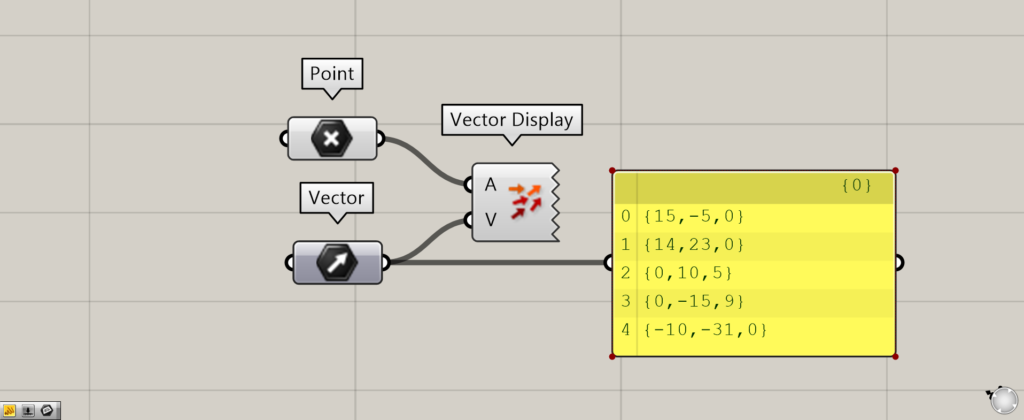
Components used: (1) Point ( 2 ) Vector (3) Vector Display
Input the point information of the position where the vector is to be displayed to the Vector Display(A).
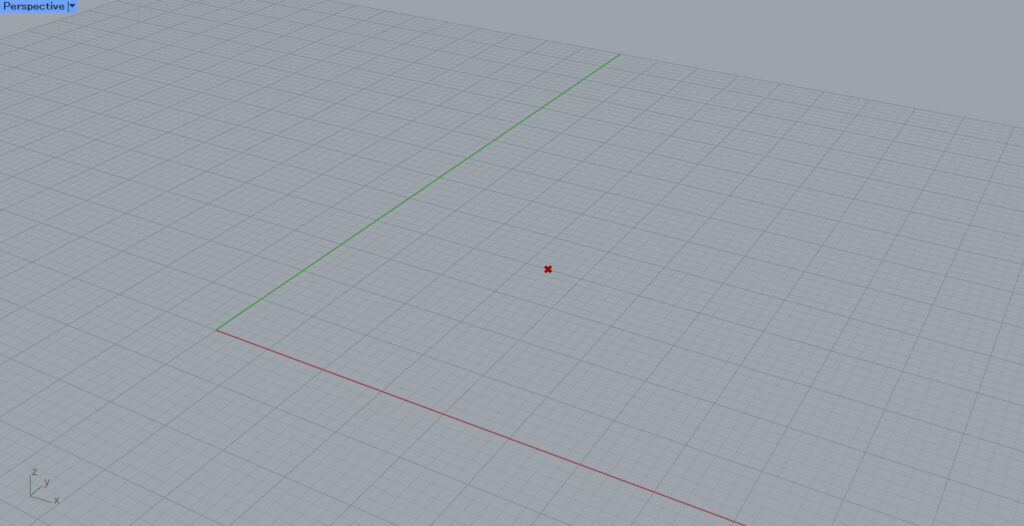
In this case, the point shown in the image above is set in Point.
In the Vector Display(V), connect the information of the vectors you want to display.
This time, 5 vectors are set in Vector.
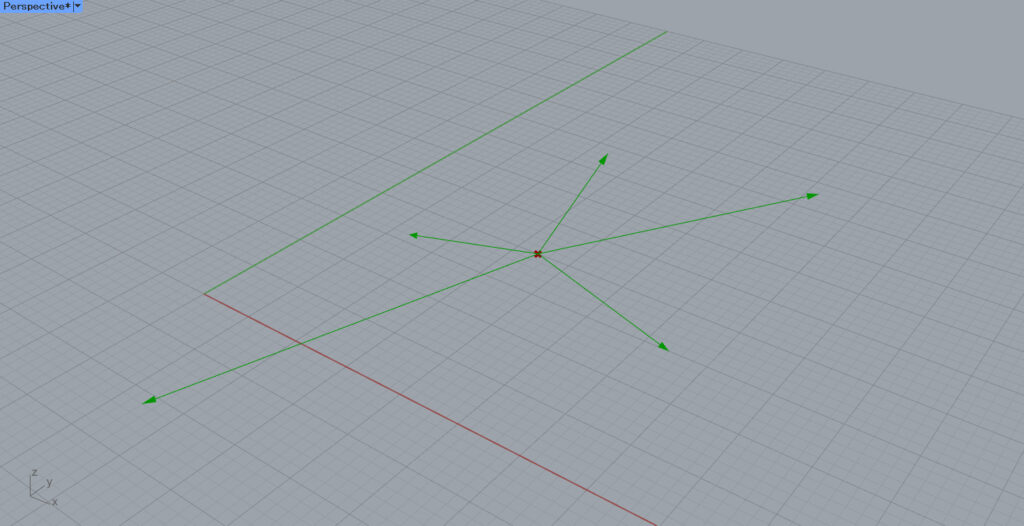
Then, the vectors are displayed and visualized at the specified position as shown here.
This time, five vectors are set in the Vector, so five arrows are displayed clearly.
Changing size of arrows
There are times when the arrows are too small even though the vectors are displayed in the Vector Display.
In such cases, we will also explain how to change the size of the arrows.
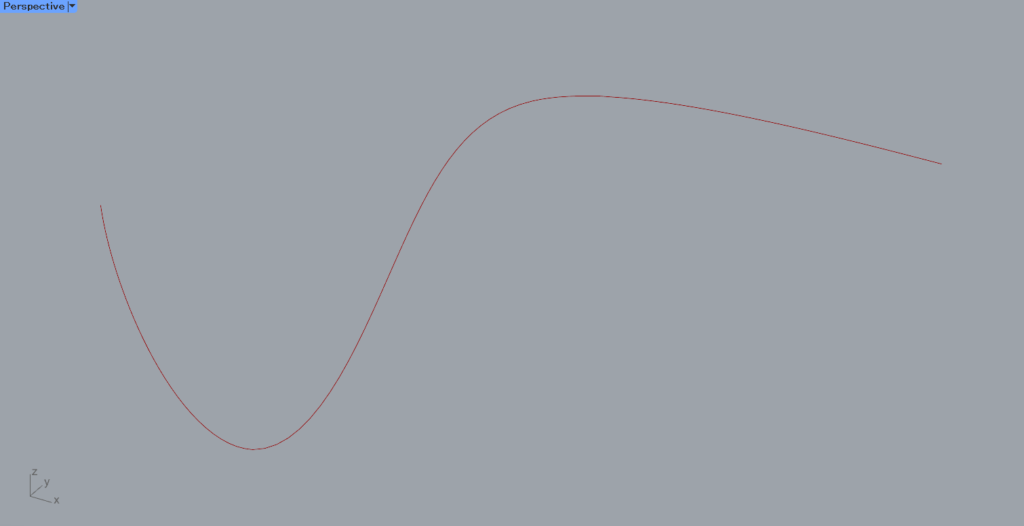
To make it easier to understand, let’s divide the curve at a point and display the vector at that position.
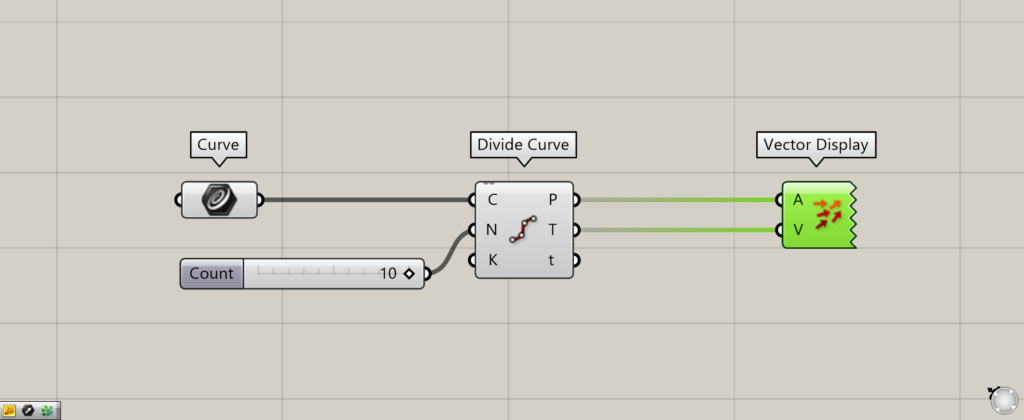
Components used: (1) Curve (2) Divide Curve (3) Vector Display
Connect the curve set in Curve to the Divide Curve(C).
Input the number of divisions to divide the curve by points to the Divide Curve(N).
In this case, 10 is entered.
Connect the Divide Curve(P) to the Vector Display(A).
Connect the Divide Curve(T) to the Vector Display(V).
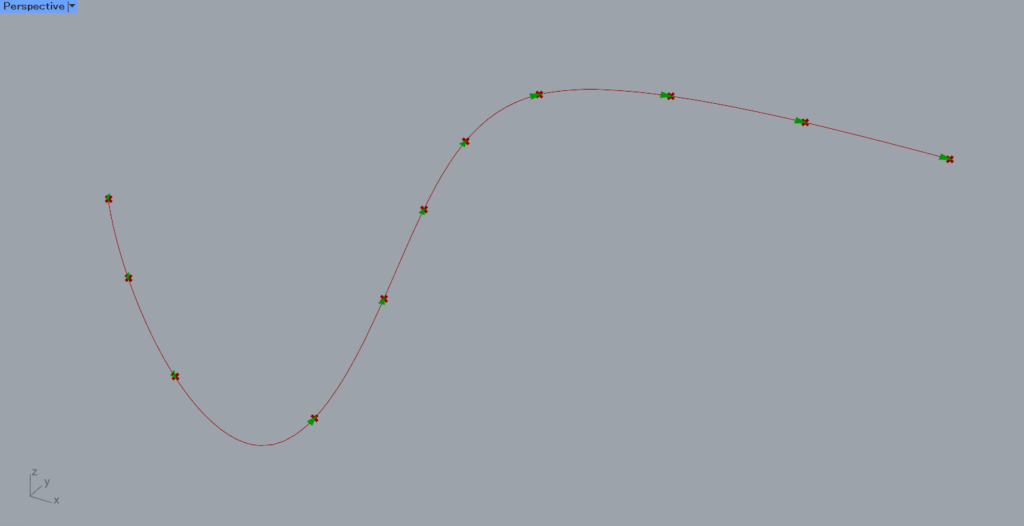
The vector is displayed as shown here, but it is very small and difficult to see.
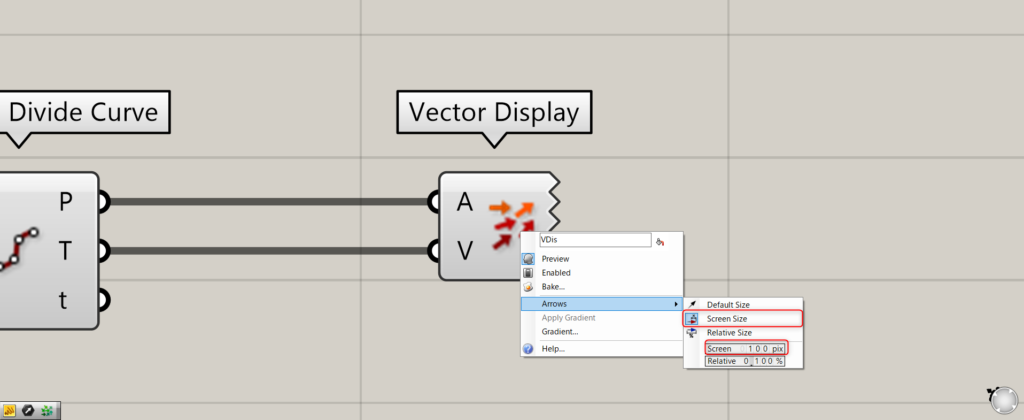
Right-click on Vector Display and select Screen Size from Arrows.
Then, increase the pix value of the Screen below.
In this case, we changed the value from 15 to 100 pix.
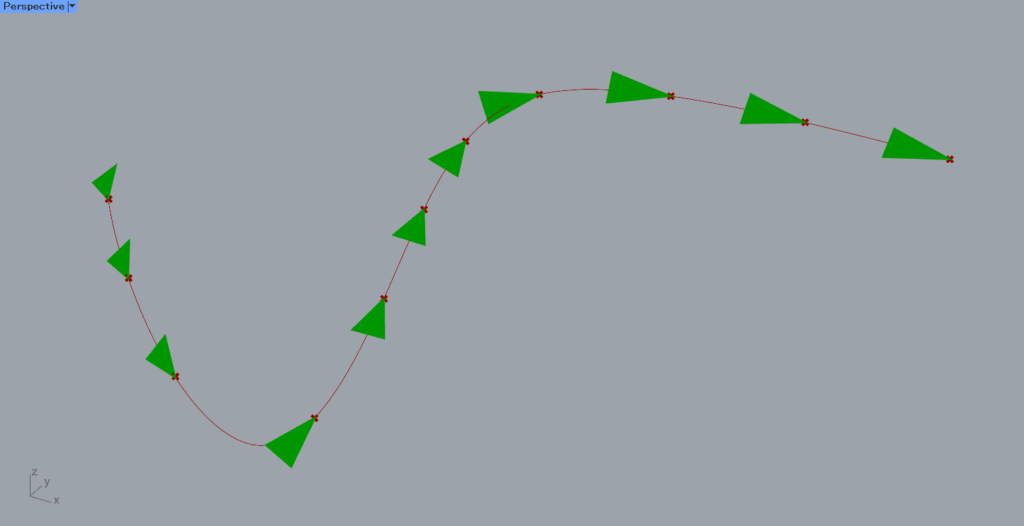
The arrow is now larger as shown here.
List of Grasshopper articles using Vector Display component↓

Comment