![[Grasshopper] How to use Control Points to display curve control points](https://iarchway.com/wp-content/uploads/2026/01/eyecatch-9.png)
This article explains how to use Control Points to display curve control points.
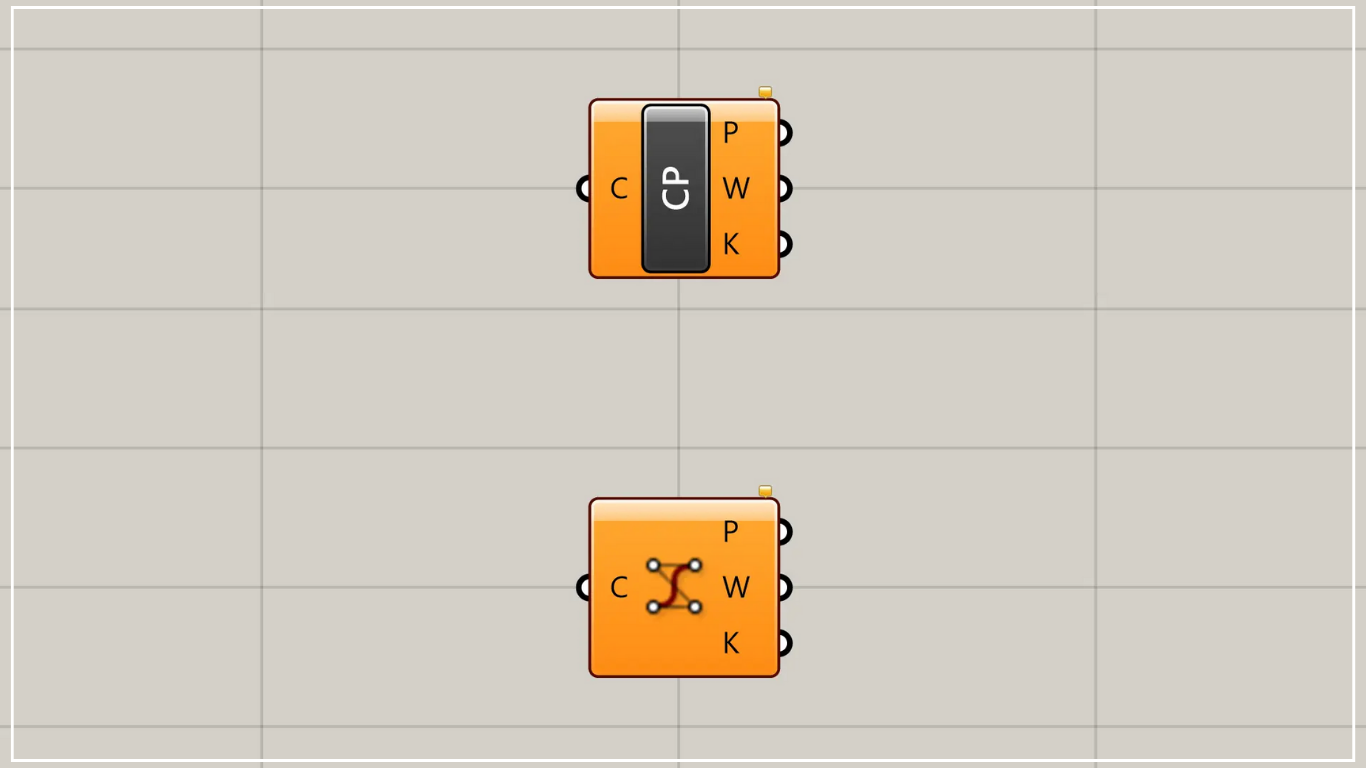
On the Grasshopper, it is represented by either of the two above.
Display control points of curves
By using Control Points, you can display control points of curves.
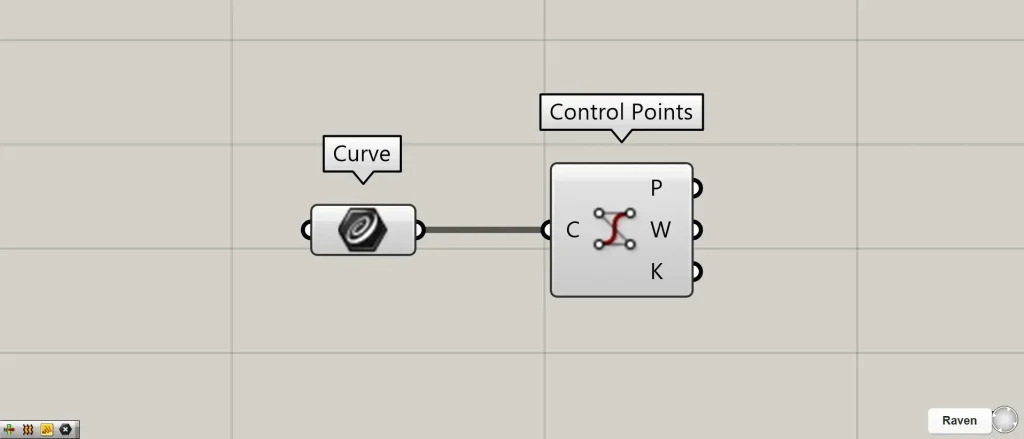
Components used: ①Curve ②Control Points
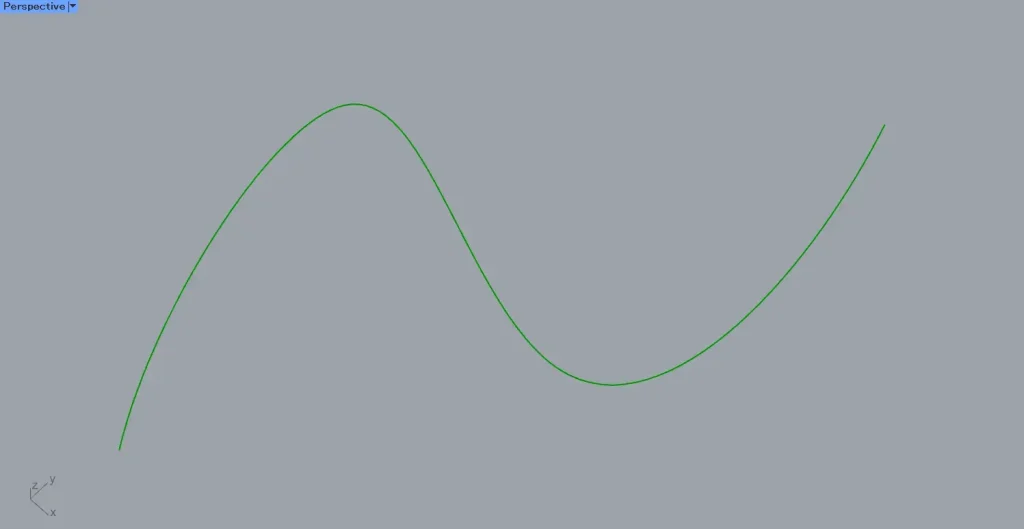
As an example, the curve in the image above is set in Curve.
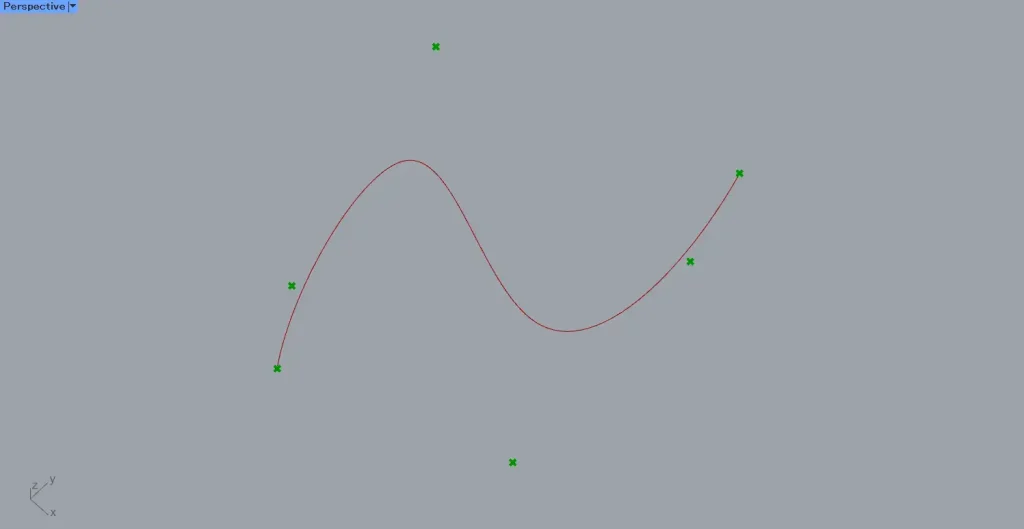
Connect the Curve to the Control points.
Then, as shown in the image above, the curve’s control points were displayed.
Additional Component: ①Point
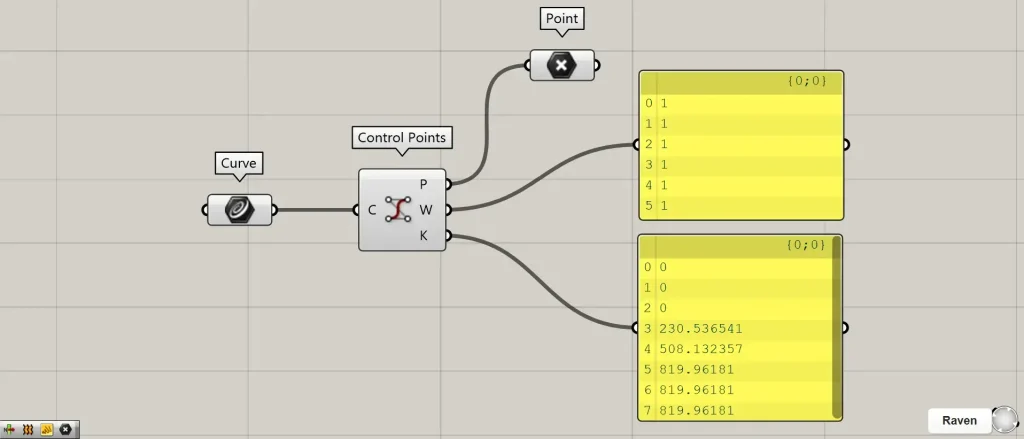
Let’s take a look at the data output from the Control Points.
Control Points(P) outputs point data for control points.
Control Points(K) outputs the numerical values of the knot vector.
For more information on knot vectors, see here.
Weight values are output from Control Points(k).
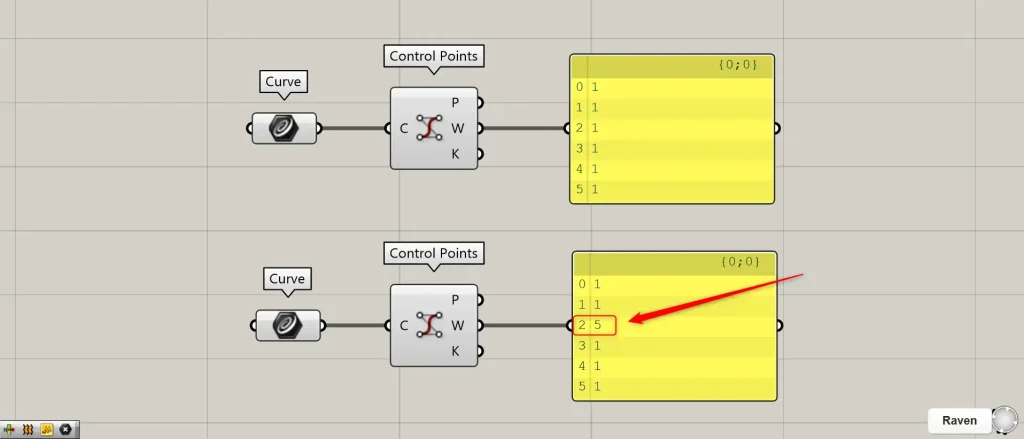
The higher the weight value, the more the curve is pulled toward the control point.
The default is 1, but let’s compare it to a line where the weight of one point has been edited to 5.
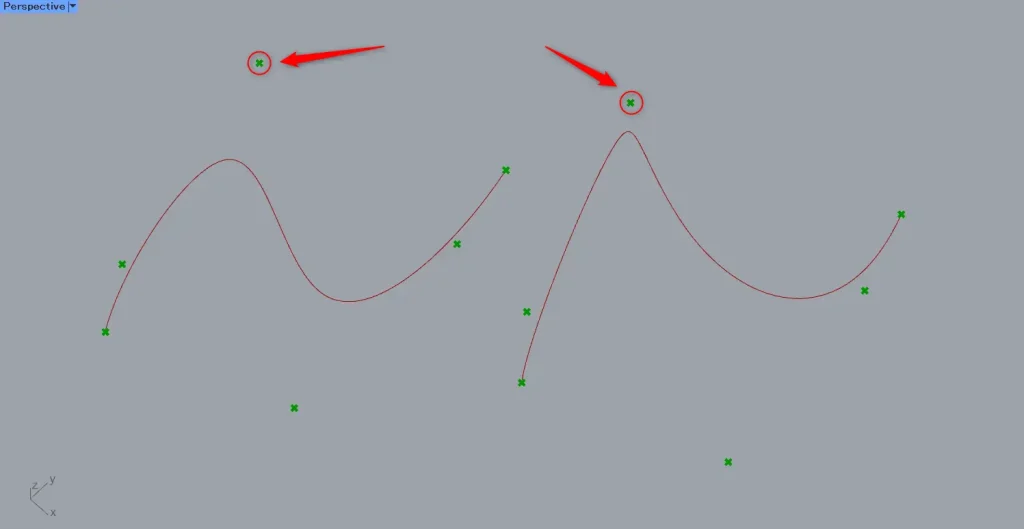
Then, you can see that the control point on the right side, which was edited, is pulling the curve more.
List of Grasshopper articles using Control Points component↓

Comment