
![[Grasshopper] How to use Curvature Graph to display curvature of a curve](https://iarchway.com/wp-content/uploads/2025/09/Curvature-Graph.png)
This article explains how to use Curvature Graph to display curvature of a curve.
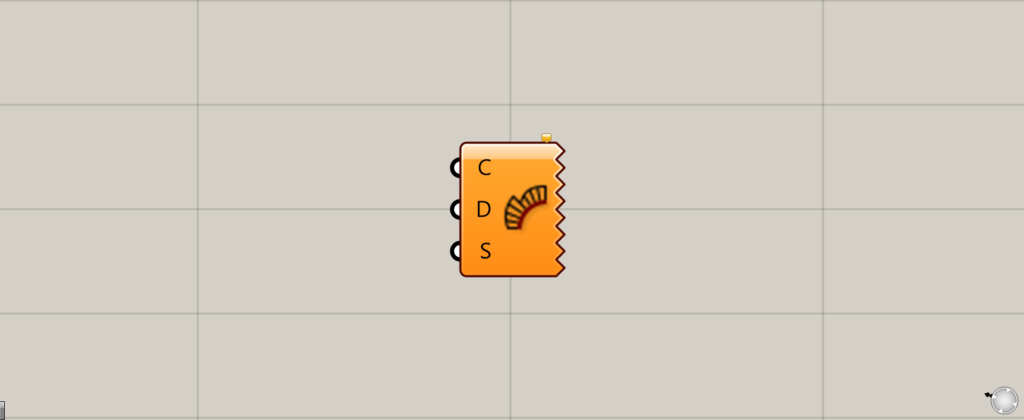
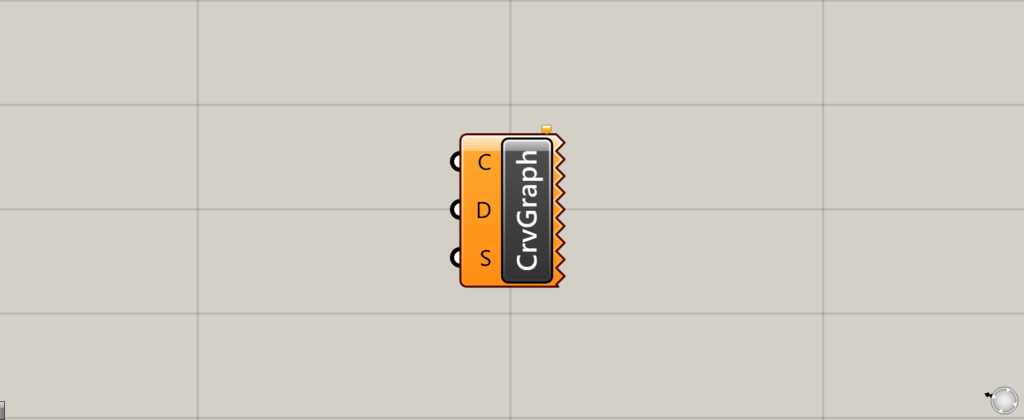
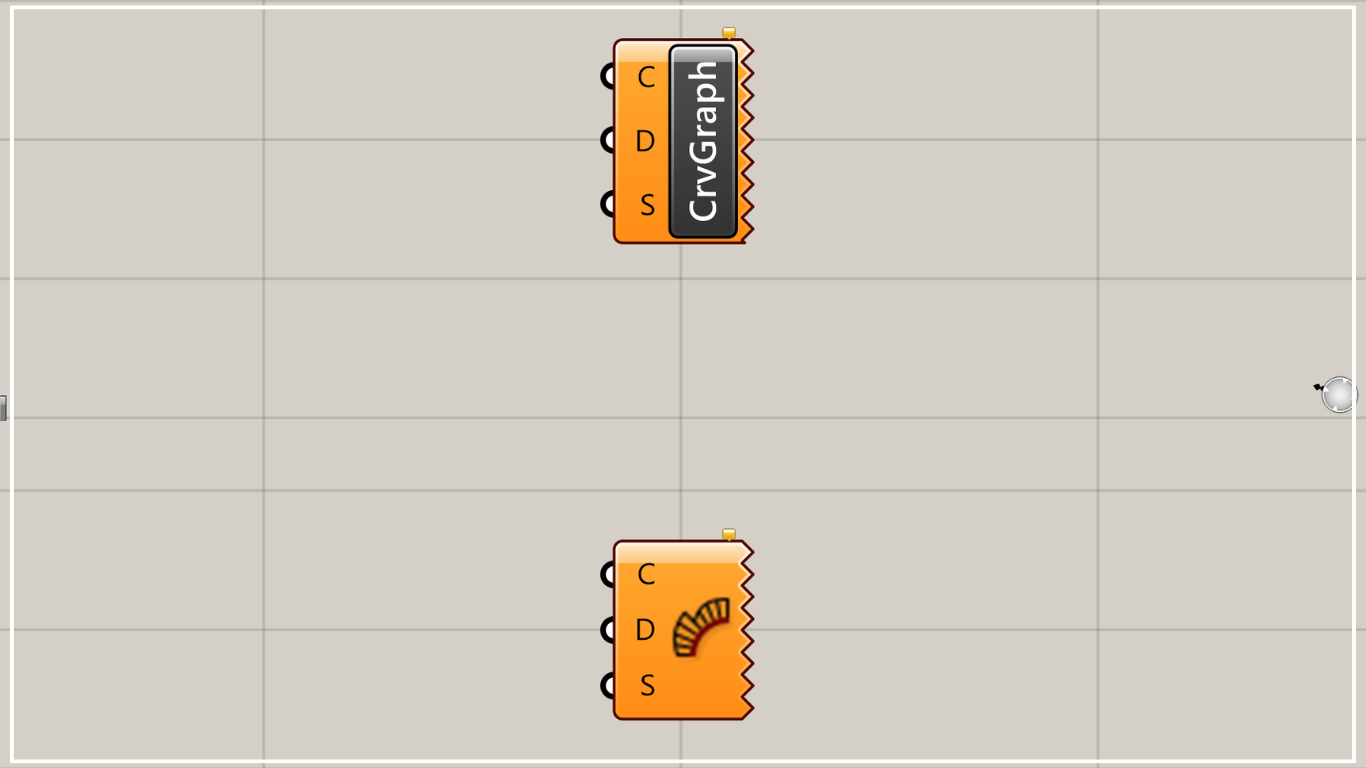
On the Grasshopper, it is represented by either of the two above.
Displaying Curvature of a Curve
Curvature Graph can be used to display the curvature of a curve.
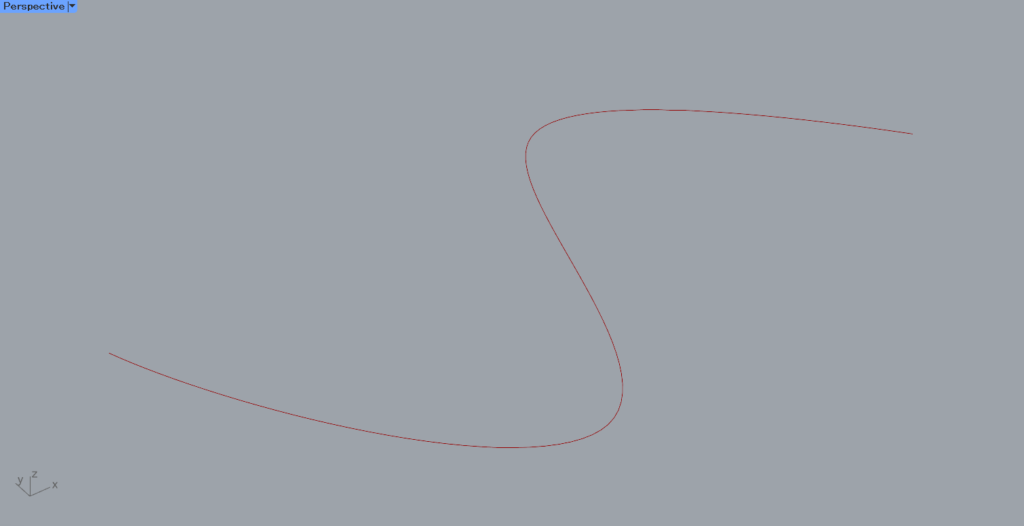
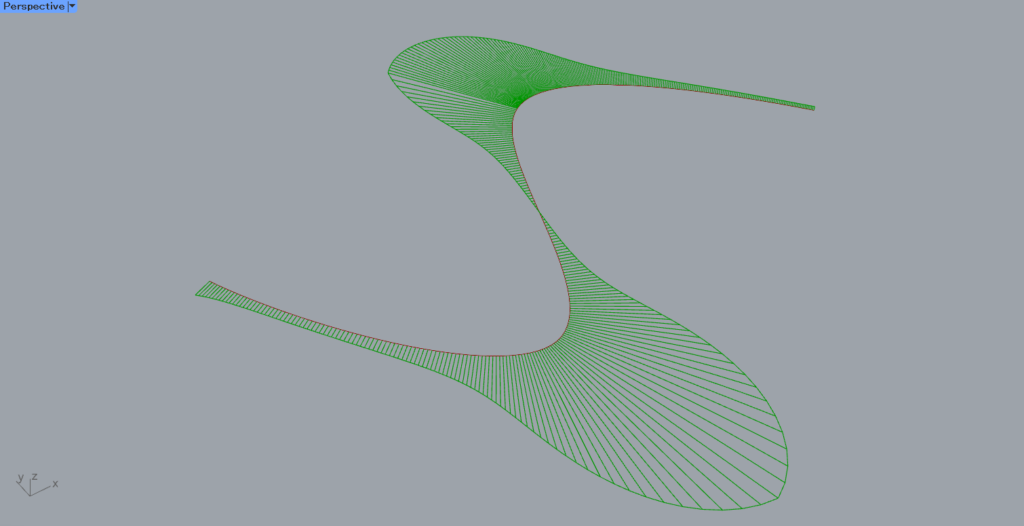
In this example, we will display the curvature of this curve.

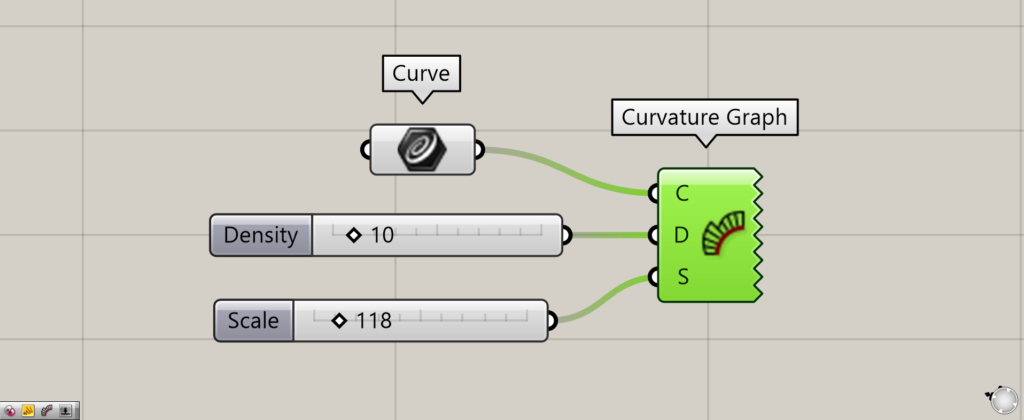
Connect the curve data to the Curvature Graph(C).
In this case, the curve is set in Curve.
Enter a numerical value for the curvature density in the Curvature Graph(D).
At first, 100 is input.
Enter the numerical value of the curvature scale to the Curvature Graph(S) to be displayed.
At first, 118 is entered.
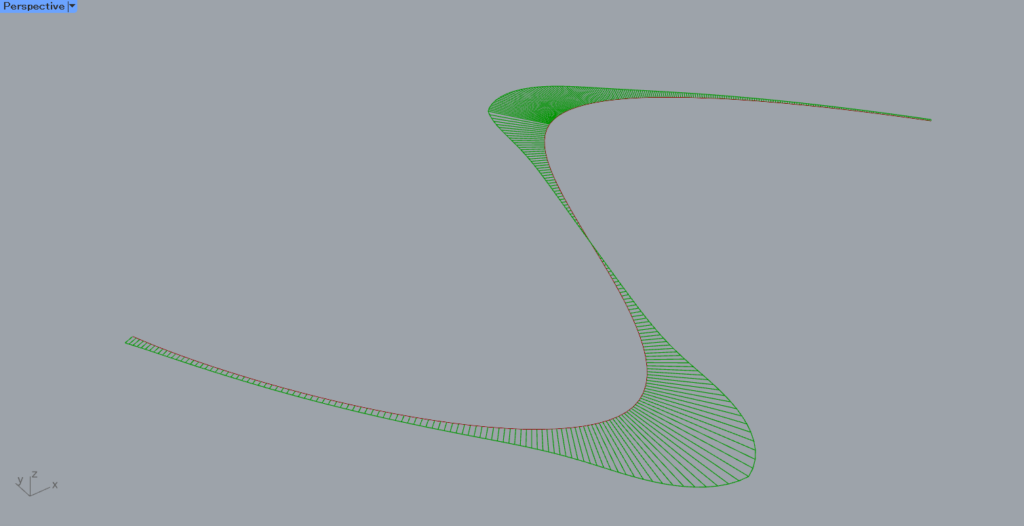
Then, the curvature is displayed as shown here.
Note that although Curvature Graph can visualize curvature, it cannot export these curves to Bake or other programs.
Try changing the value of the Curvature Graph(D) from 100 to 10 to reduce the density.
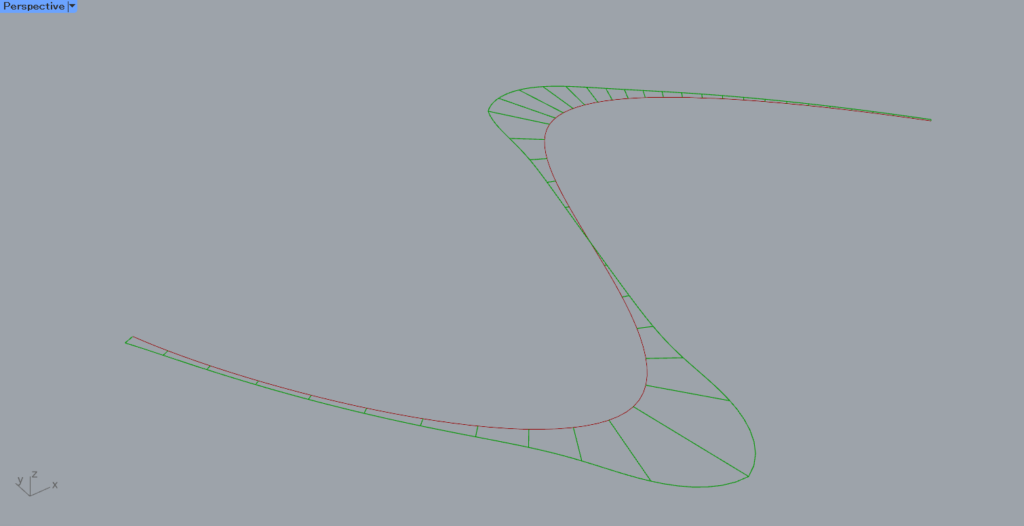
You will see that the density of the curvature curves displayed has been reduced.

Next, we change the value of the Curvature Graph(S) from 118 to 110 and lower the value of the scale.
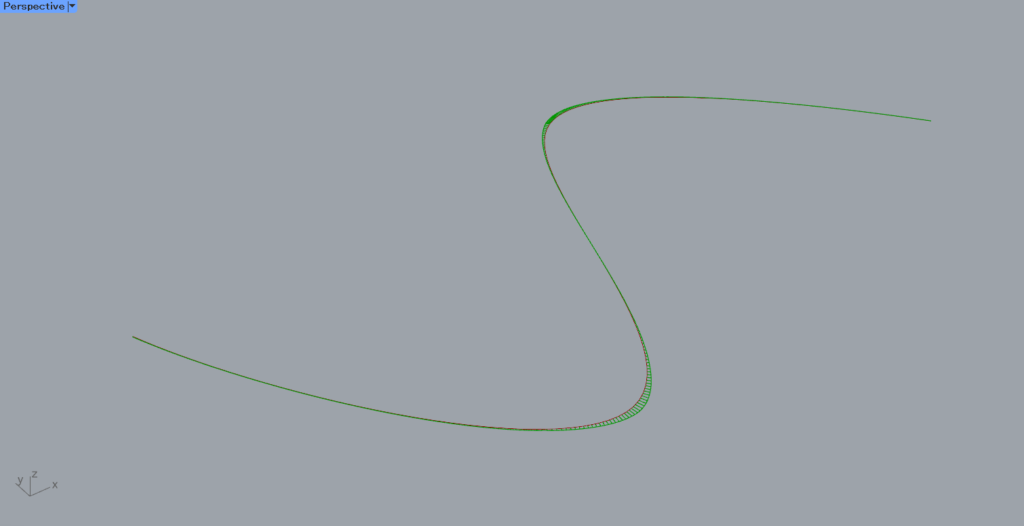
As you can see, the curvature scale has become smaller.
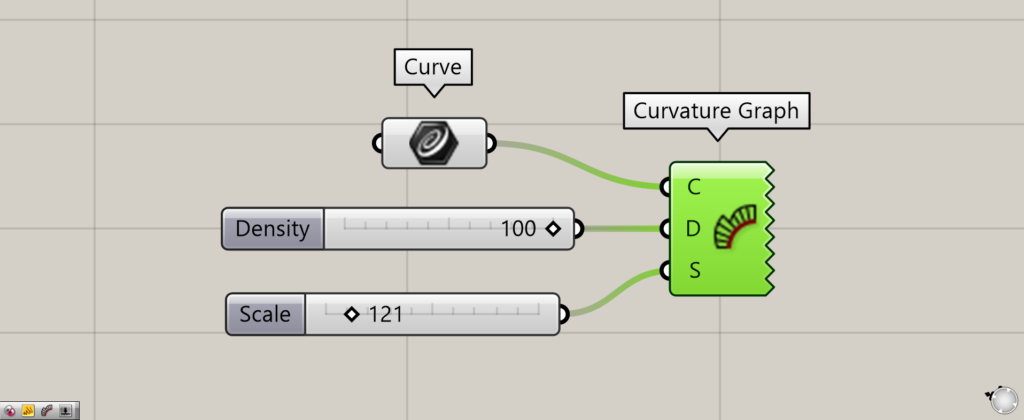
Now we set the value to 121 to increase the scale.
The curvature scale is now larger, as shown here.
List of Grasshopper articles using Curvature Graph component↓

Comment