![[Grasshopper] How to use Flatten as one method for manipulating data structures](https://iarchway.com/wp-content/uploads/2025/09/Flatten.png)
This article explains how to use Flatten as one method for manipulating data structures.

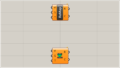
When set to Flatten, a mark like this appears at the edge of a component.
How to set Flatten and its effect
First, let’s take a look at how to set up Flatten and its effects.
Components used: (1) Entwine
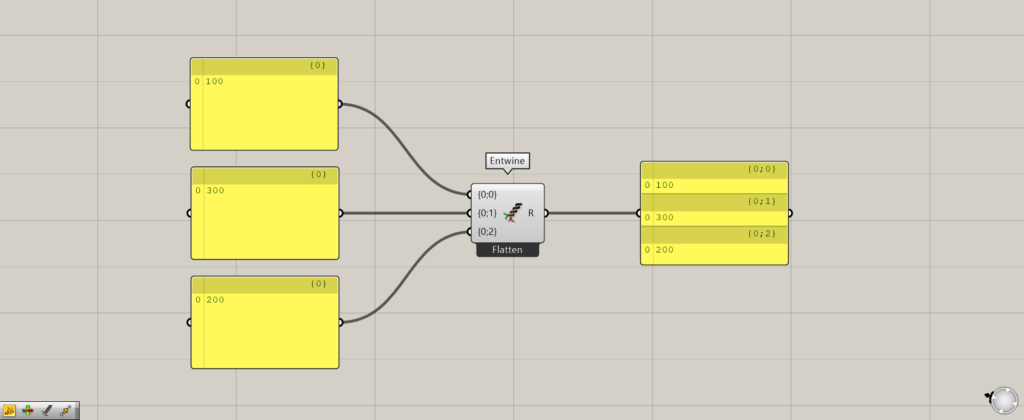
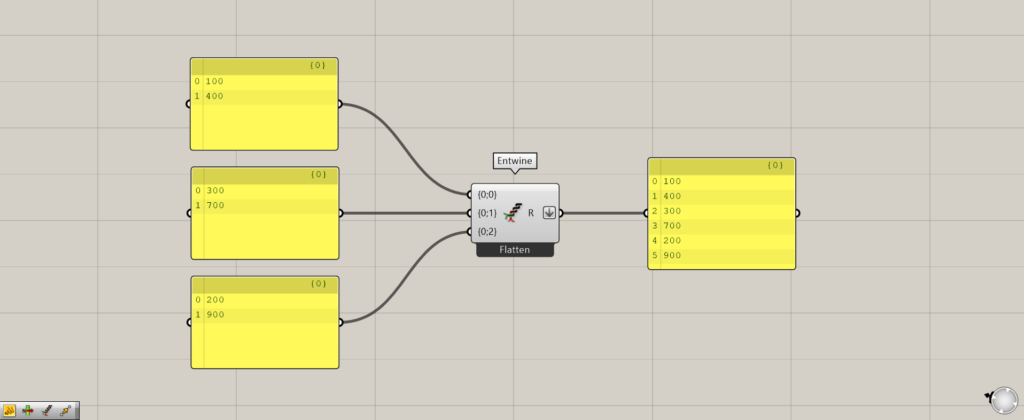
At first, using Entwine as an example, we put together three numbers 100, 300, and 200.
Then, the branch of {0;0} outputs 100, the branch of {0;1} outputs 300, and the branch of {0;2} outputs 200, respectively.
Let’s try Flatten.
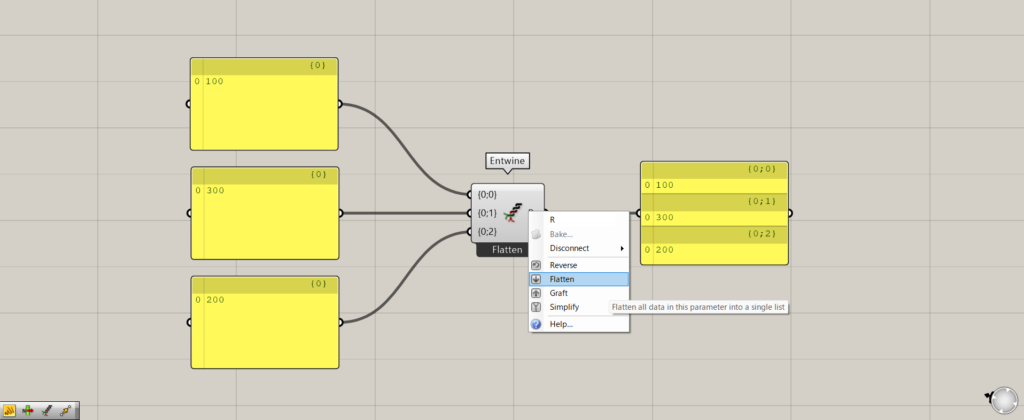
Right-click on the edge of the component and select Flatten.
In this case, I right-clicked on the Entwine(R) and set it.
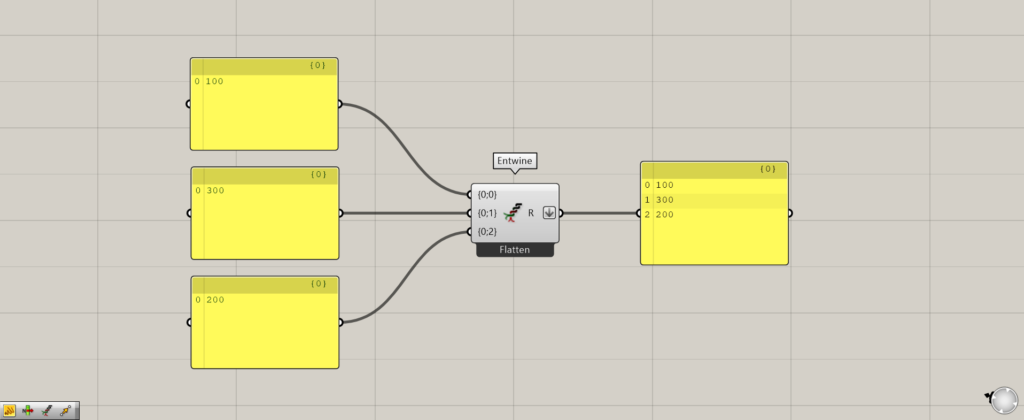
Then the branches of {0;0}, {0;1}, and {0;2} became one of {0}, and the values of 100, 300, and 200 were combined.
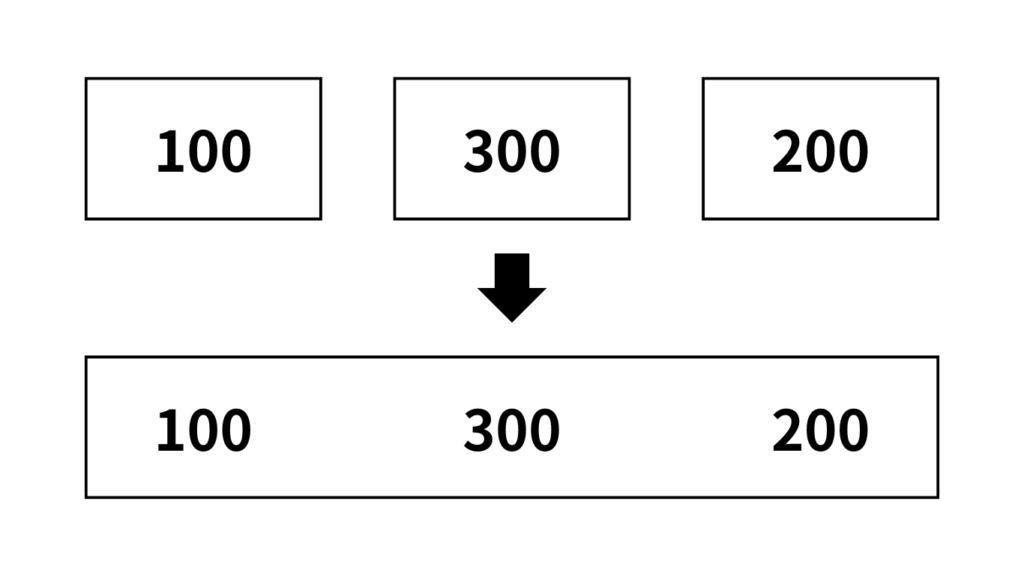
The data structure is easier to understand if you think of it as a box.
Before Flatten, the 100, 300, and 200 numbers were in separate boxes.
After setting Flatten, the separate boxes are combined into one.
They were then combined into one box for each number.

Now let’s try entering two numbers in Entwine, one for each.
The first is 100 and 400, the second is 300 and 700, and the third is 200 and 900.
Before Flattening, the branch of {0;0} outputs 100 and 400, {0;1} outputs 300 and 700, and {0;2} outputs 200 and 900.
Flattening, again, merged the three branches {0;0}, {0;1}, and {0;2} into a single {0} branch.
This also combines the numerical values into one hierarchy.
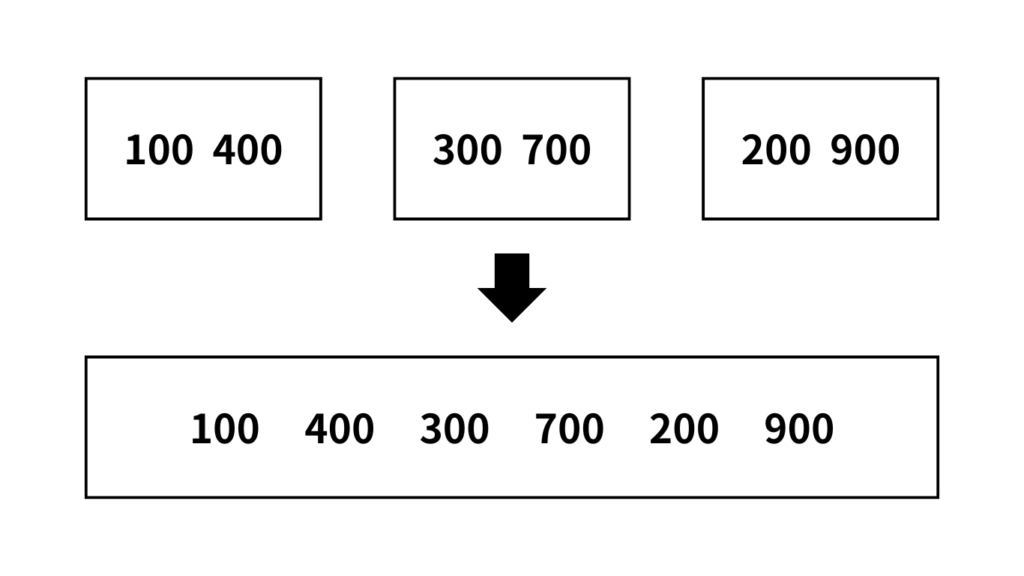
In this case, we still think in boxes.
Before Flattening, each of the three boxes contains two values.
After Flattening, the boxes are merged into one box, and the values in the boxes are also merged into one box.
Thus, by setting Flatten, multiple levels of branch can be combined into one.
.Example of Flatten Usage
Let’s take a look at an example of using Flatten to see how it changes before and after use.
In this case, we create a single line and divide it at a point.
Then we will move that line upward, using Flatten to see the change.
Components used: (1) Line (2) Divide Curve (3) Entwine (4) Unit Z (5) Move
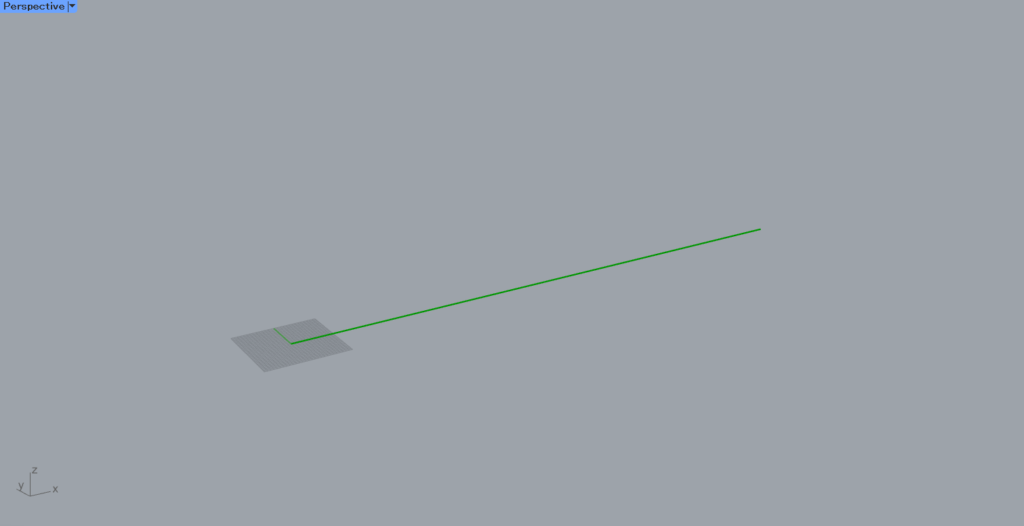
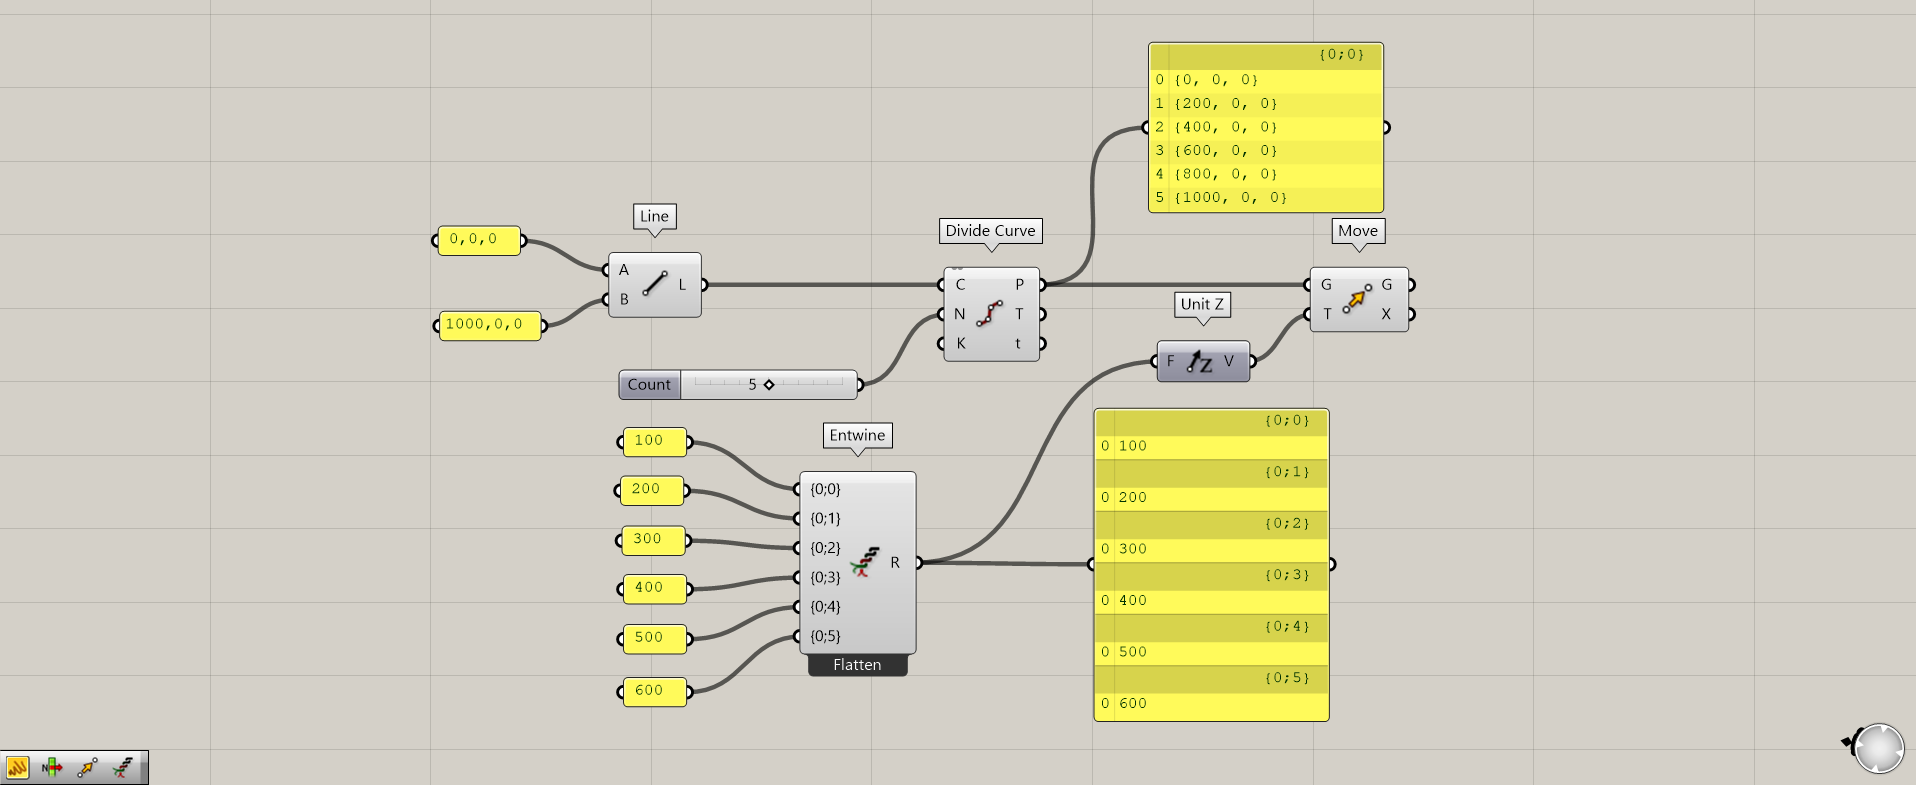
Input coordinates to the Line(A and B) and create a line connecting the coordinates.
This time, the coordinates are set to 0,0,0 and 1000,0,0.
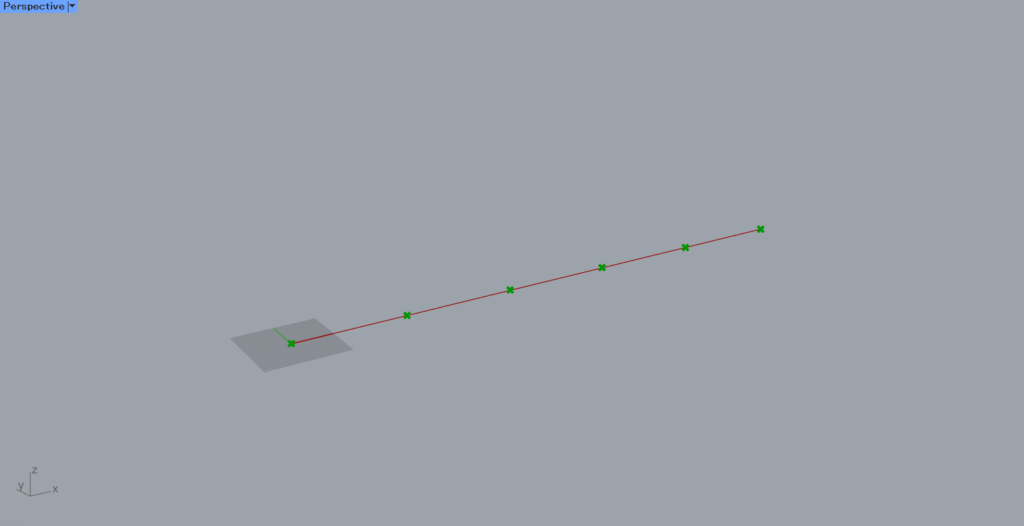
Then, using Divide Curve, divide the line at the points.
Enter the number of divisions(N).
This time, 5 is entered as the number of divisions, so 6 points are created to divide the line into 5 lines.
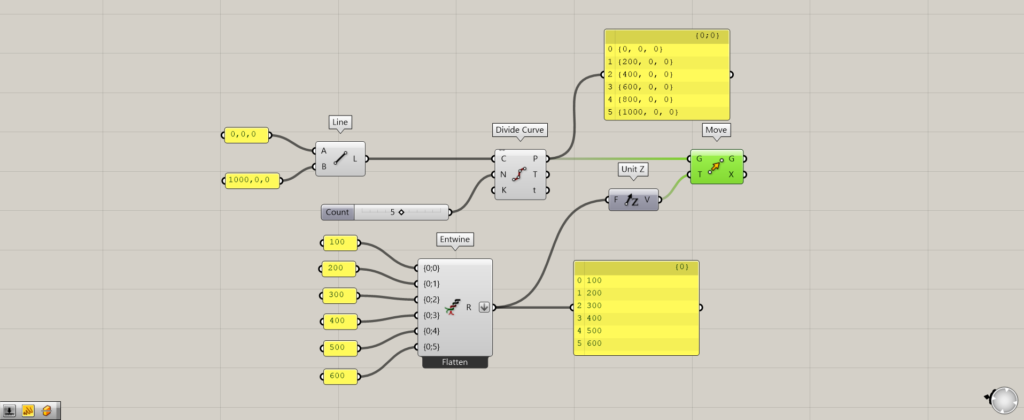
At first, let’s look at the case without Flatten.
Then connect the height values of 100, 200, 300, 400, 500, and 600 to Entwine.
Then, by connecting to Unit Z, we reflect the vector in the direction directly above.
Connecting Divide Curve to the Move(G) and Unit Z to the Move(T) causes the points to move upward.
Looking at the data structure as a box, the points are in a state where six points are grouped together in one box.
On the other hand, the height values have one value in each of the six boxes.
This is a single box and multiple box type. (Flatten and Graft types)
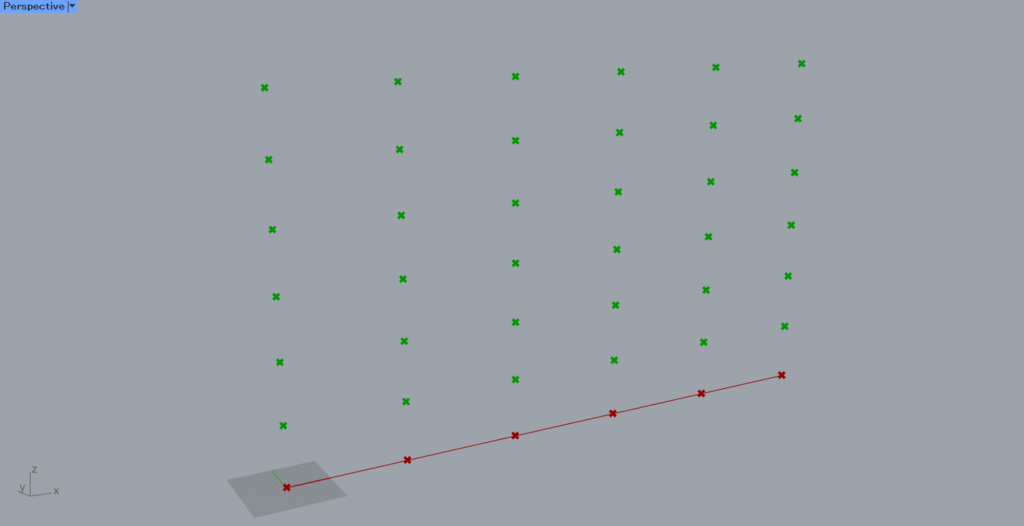
In this case, the height value in one box is reflected in all six points in one box.
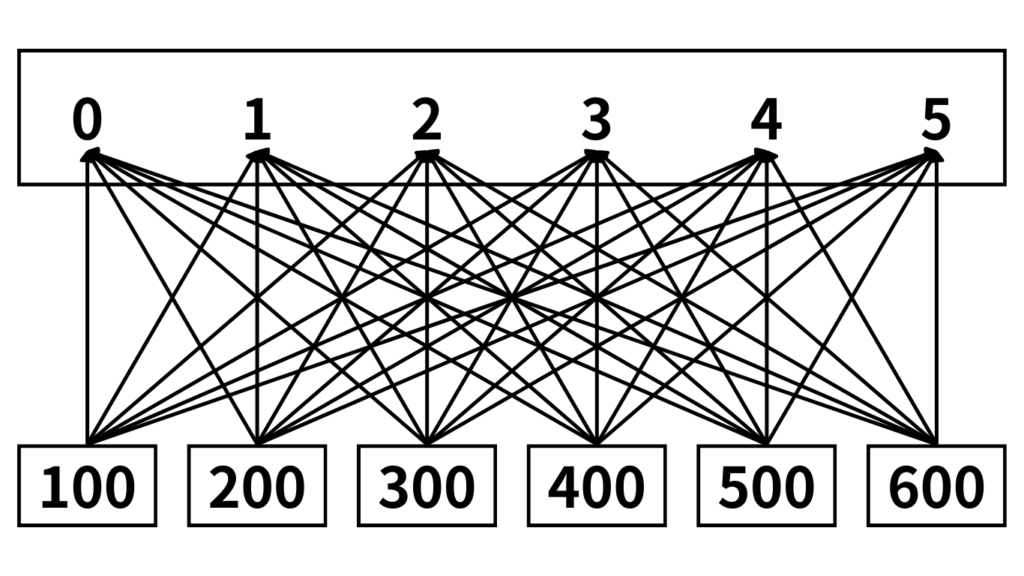
Therefore, when looking at the height values 100~600, each value is reflected in all the points, as shown in the figure above.
So, as you can see, all the points have been moved upward from 100 to 600.
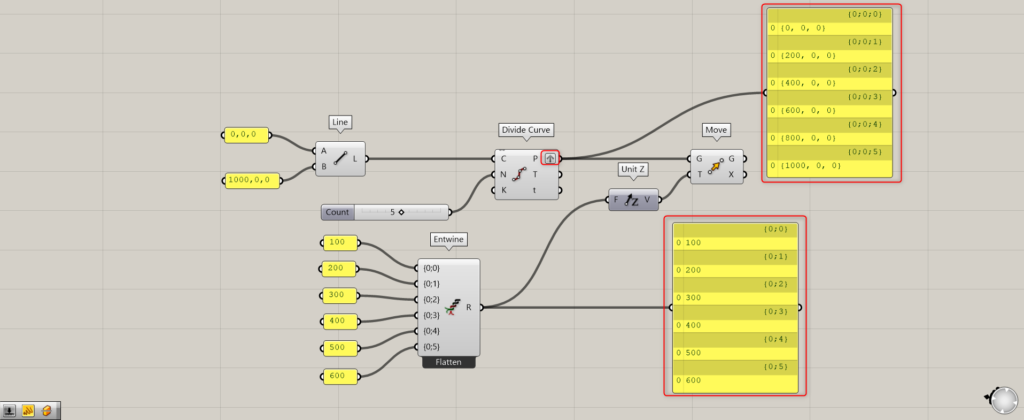
Let’s look at the case of Flatten.
In this case, the Entwine(R) is Flattened.

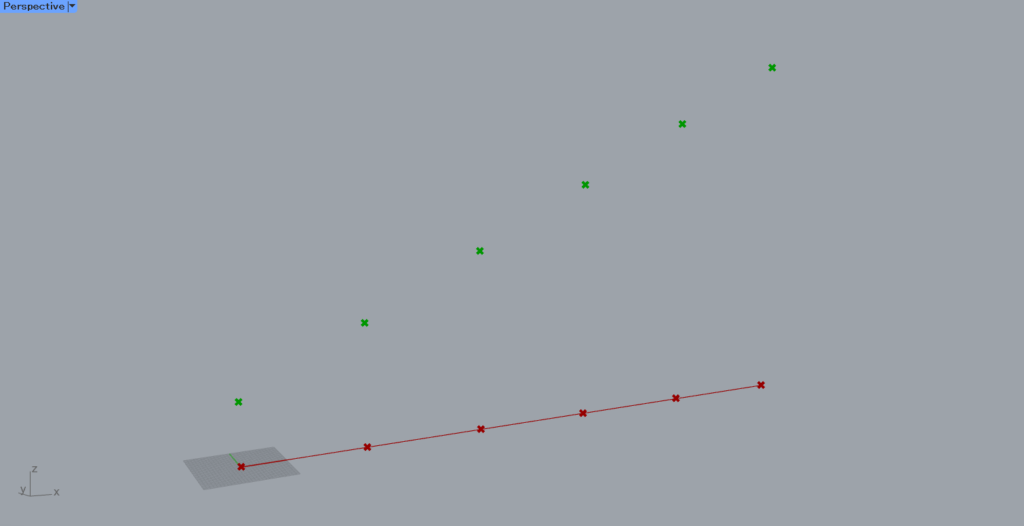
As a result, each point has been moved one by one in a staircase-like manner as shown here.
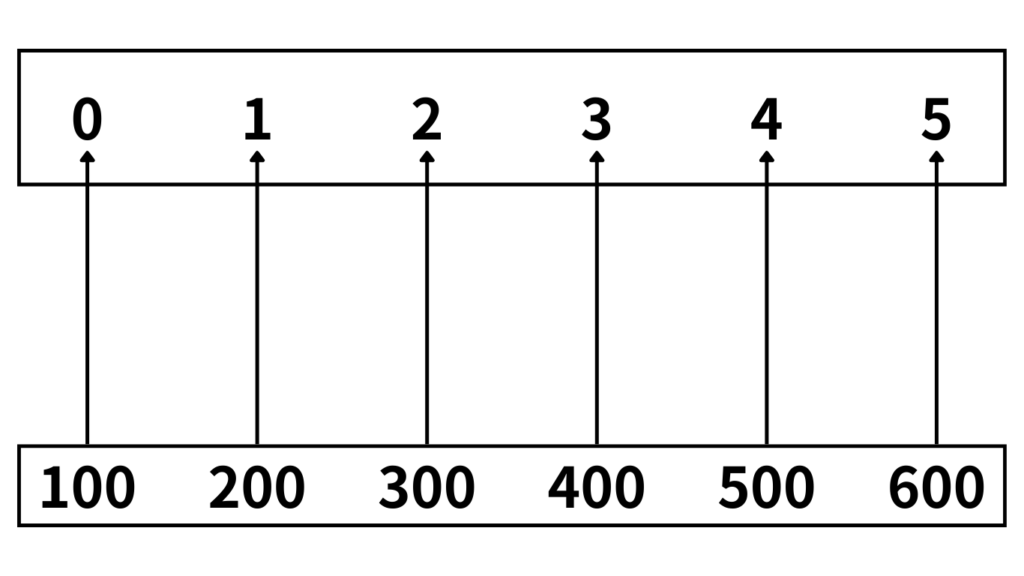
If we look at the data structure as a box, this time the height values, six values were combined in one box.
Similarly, in one box, six points are grouped together.
This is two box types. (both Flatten type)
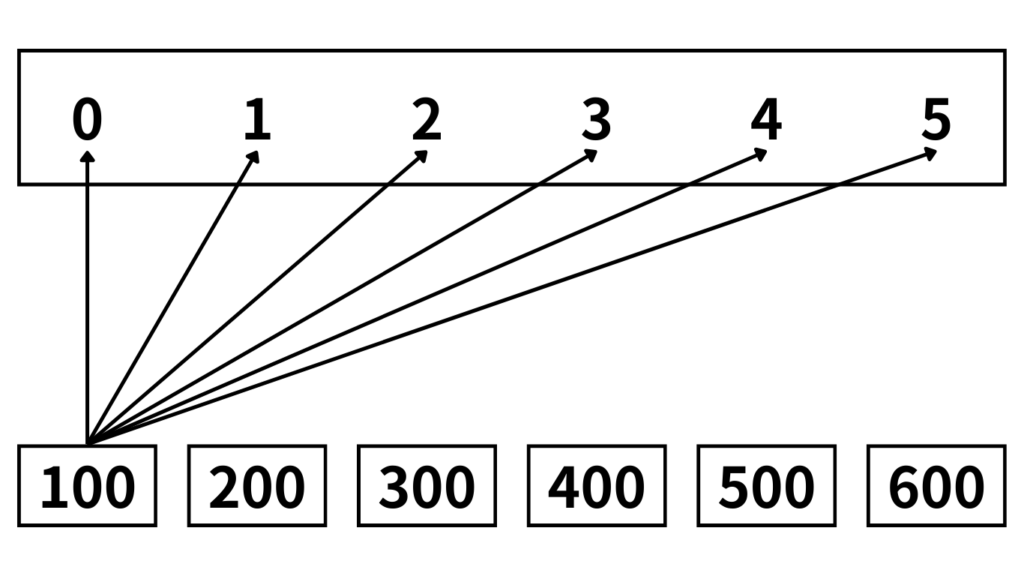
In this case, a single height value is reflected only on points at the same location (same index number).
In this case, point 0 reflects 100, point 1 reflects 200, point 5 reflects 600, and so on.
Therefore, if Flattening is not done, all height values are reflected in one point.
However, when Flattened, one height value was assigned to one point.
Although not Flattened, let’s also look at the case where the two data structures are Graft as an extra case.
Set the Divide Curve(P) to Graft.
Then the data structures of the point and height values are together.
If we look at the data structure as boxes, we see that the height values are grouped into six boxes, one for each of the six boxes.
Similarly, there is one point in each of the six boxes.
This is a multiple box type of two sets. (Both are Graft types).
In this case, the effect is assigned only to the boxes in the same position.
In the case of the image above, 100 is assigned to point 0, 200 to point 1, and 600 to point 5.
Therefore, in this case also, one height value is assigned to each point, so only one of each is moved, resulting in a staircase effect.
List of Grasshopper articles using Flatten↓


Comment