
![[Grasshopper] How to use Graph Mapper to utilize graphs](https://iarchway.com/wp-content/uploads/2025/08/Graph-Mapper.png)
This article explains how to use Graph Mapper to utilize graphs.
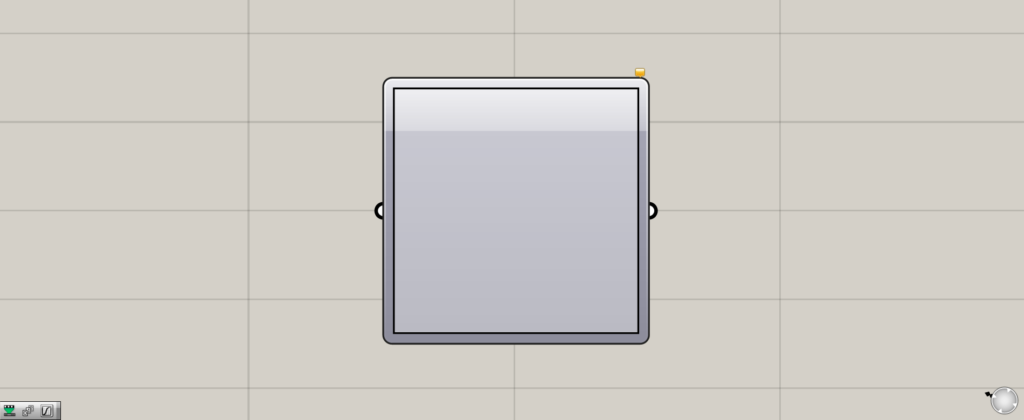
On the Grasshopper, the graph is represented as shown above.
Types of Graphs
Graph Mapper can be used to take advantage of graphs.
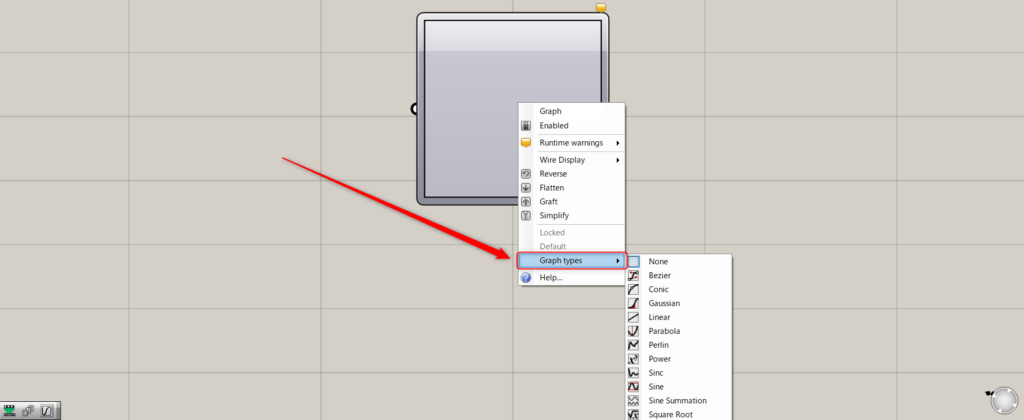
Right click on Graph Mapper and select Graph types.
You can then choose from 11 different types of graphs.
Graph types
Bezier
Conic
Gaussian
Linear
Parabola
Perlin
Power
Sinc
Sine
Sine Summation
Square Root
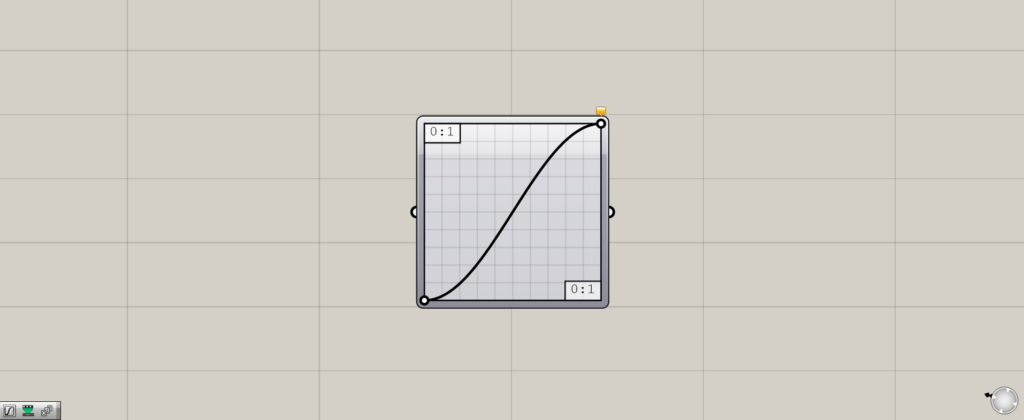
This time, we will use the Sine graph.
Setting up the graph and entering numerical values
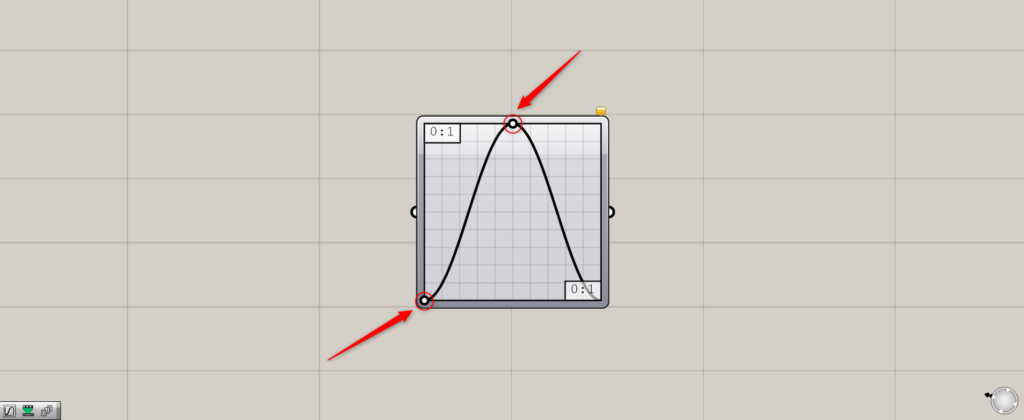
The shape of the graph can be changed by moving the white circle on the graph.
In this case, the shape of the graph is shown in the image above.
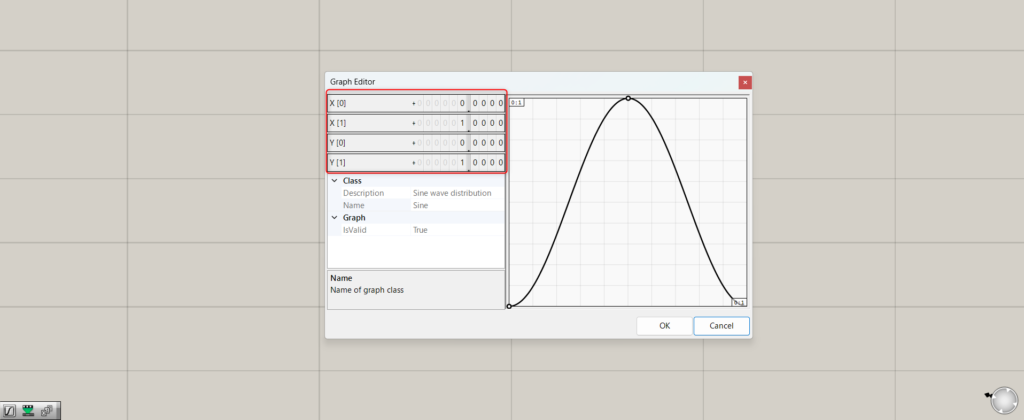
Double-clicking Graph Mapper, a window similar to the one above appears.
By changing the values in the upper left corner, you can change the range of X and Y values.
In the initial state, the X and Y ranges are set in the range of 0~1.

The left terminal of Graph Mapper is used to input the numerical value of X.
In the initial state, X and Y range from 0~1, so input values within that range.
In this case, 0.3 is entered, so a red line appears at the 0.3 position.
Then, the numerical value of 0.65… in Y corresponding to 0.3 in X is output from the terminal on the right.
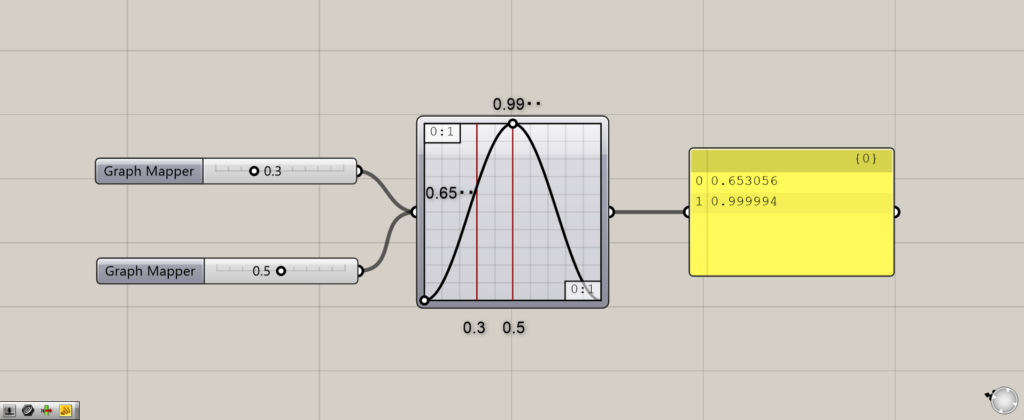
Multiple values can also be input.
In this case, 0.3 and 0.5 were entered as the values of X.
Then, 0.65… and 0.99… of Y, which correspond to 0.3 and 0.5 of X, are output from the right side.
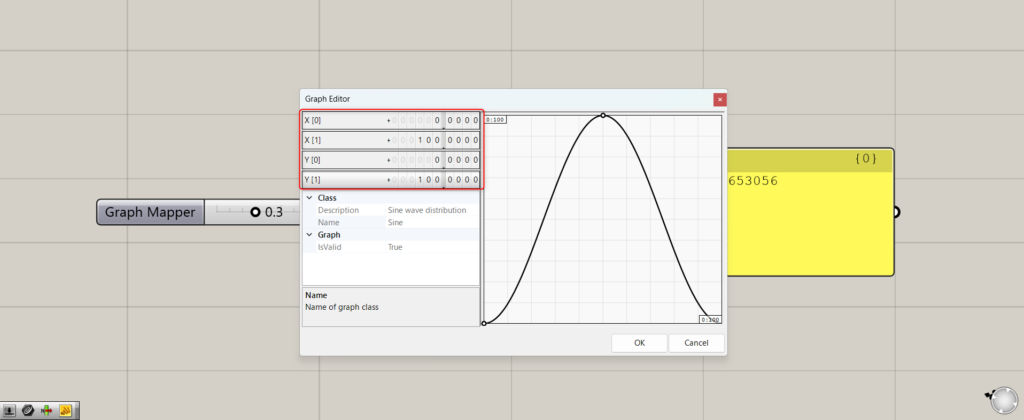
Let’s change the range of values.
The range of the X and Y values was 0~1 until now, but we changed it to 0~100.
Then, the input X value can now be input from 0~100.
Correspondingly, the output Y value will also be output in the range 0~100.
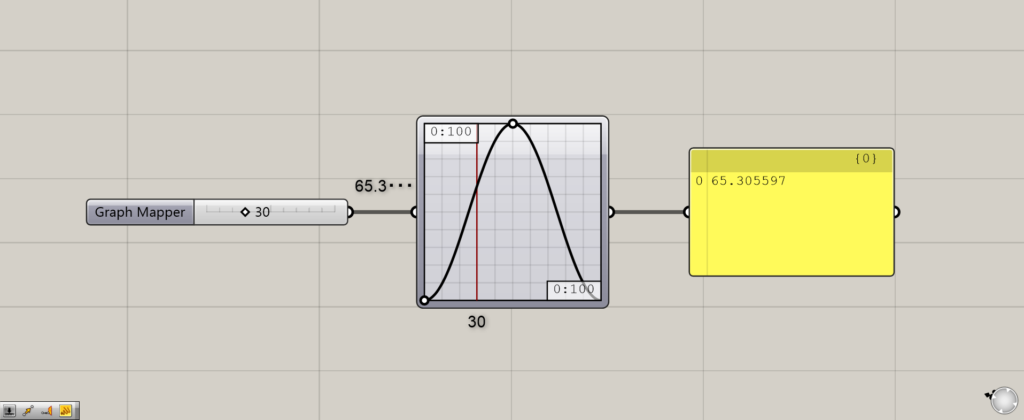
In this case, 30 was entered and 65.3… was output as the result.
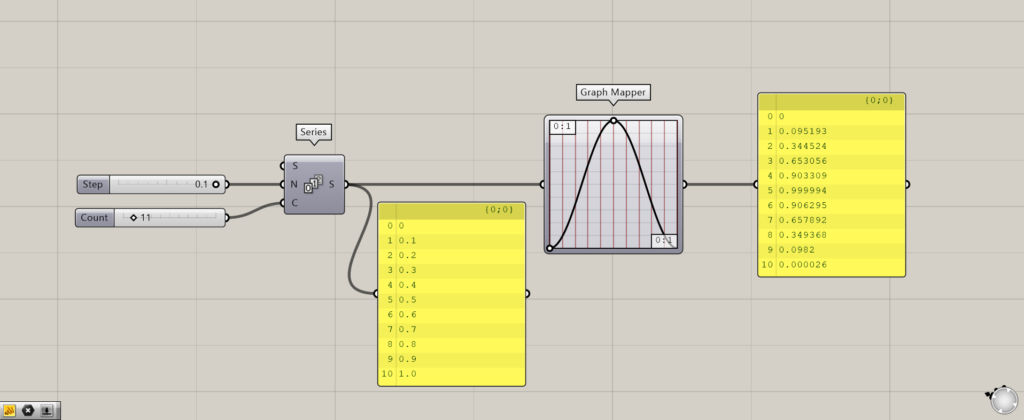
Series can be used to create a series of equally spaced numbers.
This makes it easy to specify multiple values of X at equal intervals.
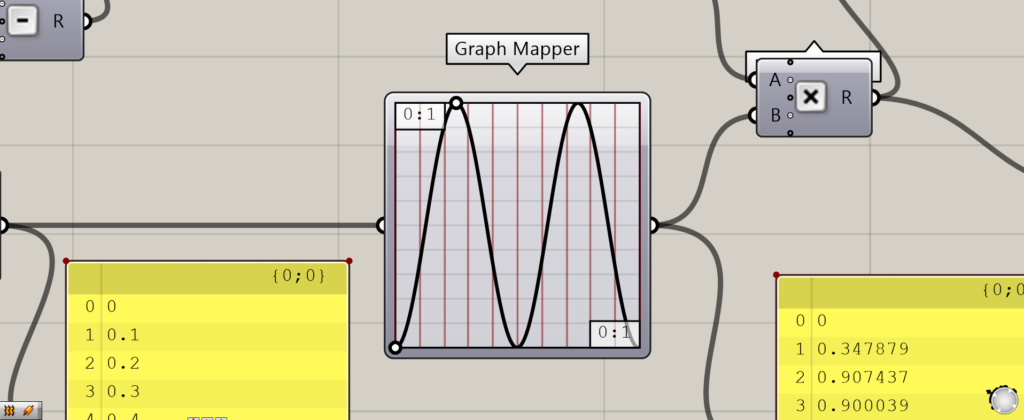
In this case, 0.1 was input to the Series(N) and 11 to the Series(C).
This created a sequence of numbers that increases by 0.1 until it reaches 1.0.
By connecting this to Graph Mapper as the value of X, we can now output a numerical value for Y for every 0.1 numerical value of X.
.Example of Use
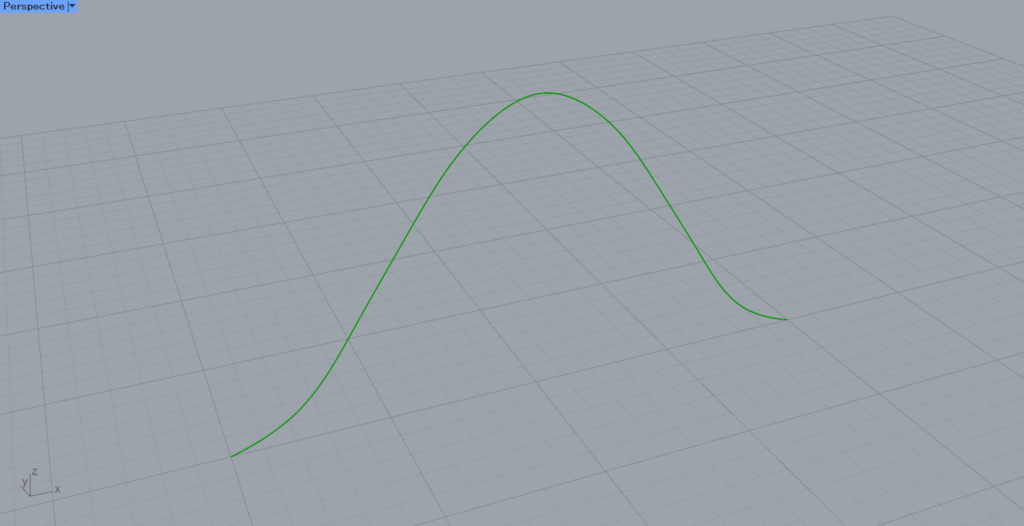
Let’s try actually using Graph Mapper to create a curve like the one shown in the image above.
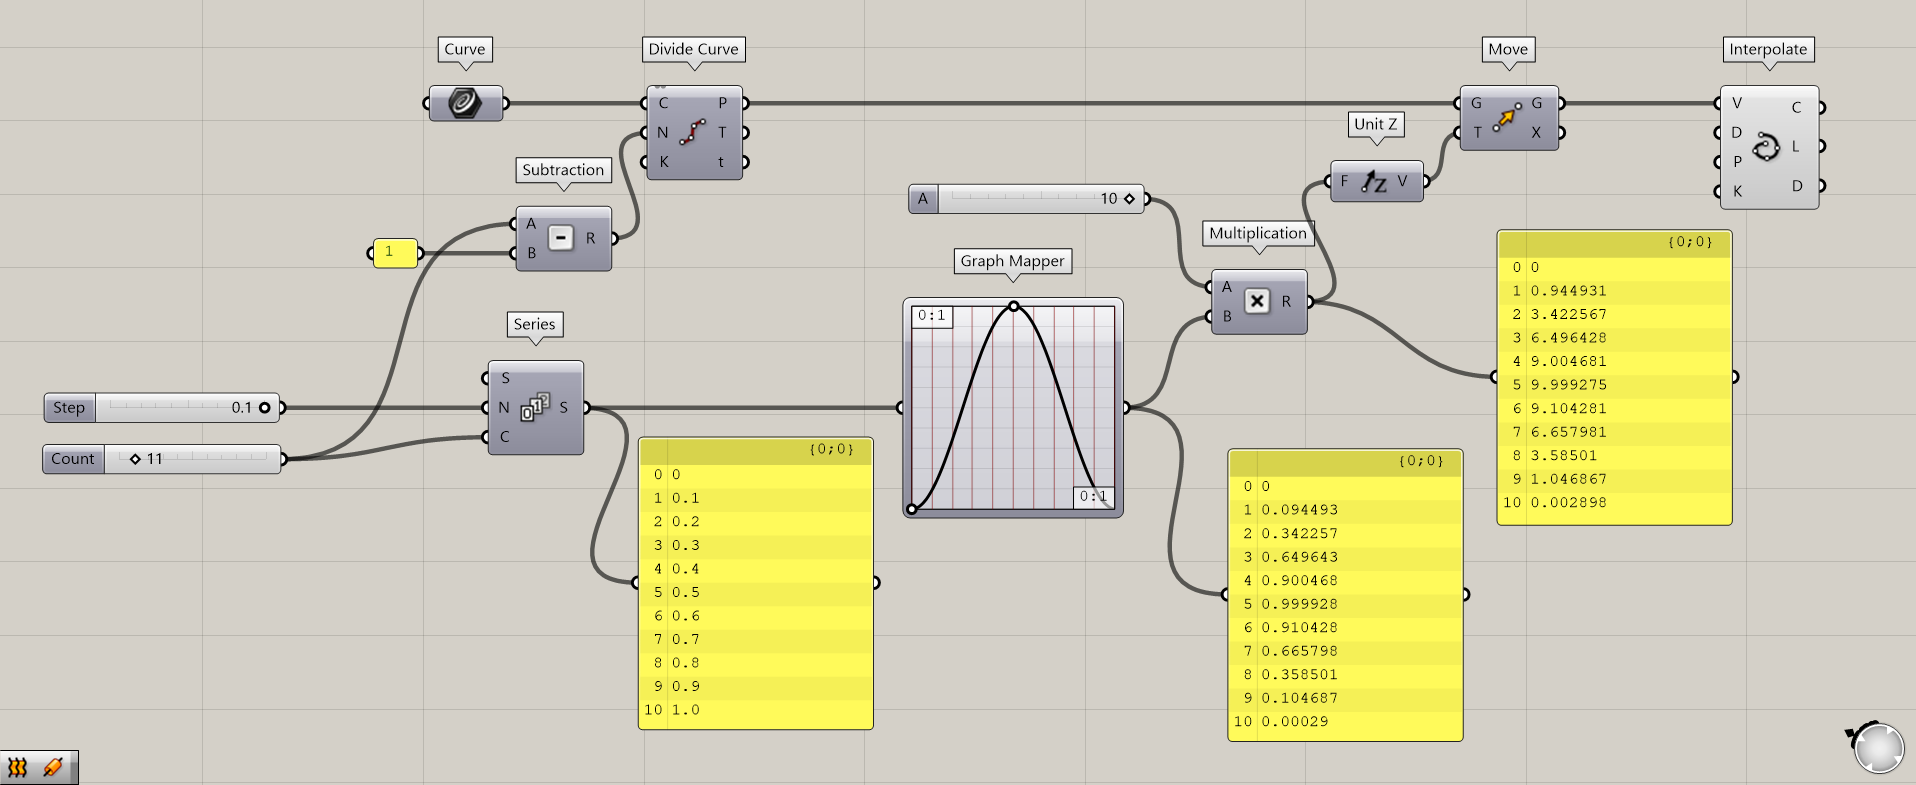
Components used: (1) Curve ( 2 ) Subtraction (3) Divide Curve ( 4 ) Series (5) Graph Mapper ( 6 ) Multiplication (7) Unit Z (8) Move (9) Interpolate
Here are the overall components.
First, prepare one curve and store it in Curve.
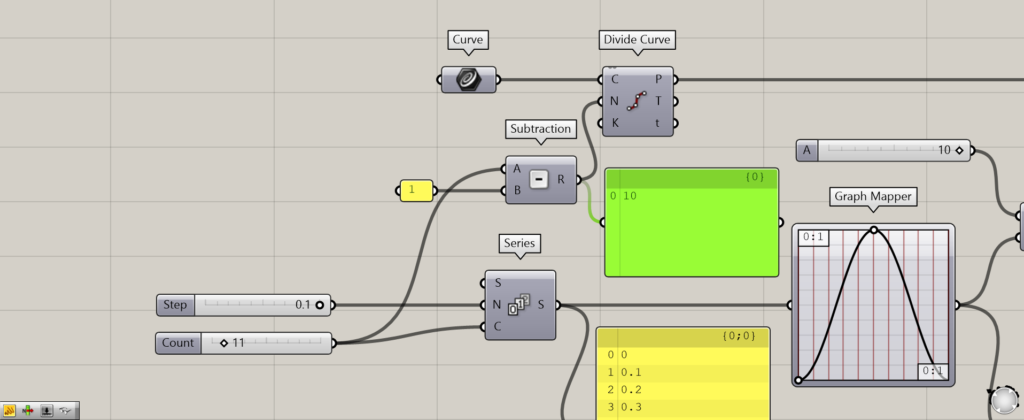
Connect 11, which is to be connected to the Series(C), to Subtraction and subtract by 1.
The reason for this is that the Divide Curve used next will create 12 points when the value 11 is entered.
In order to create 11 points, we subtract by 1 to make 10.
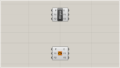
Then, connect Curve to the Divide Curve(C) and Subtraction to the Divide Curve(N).
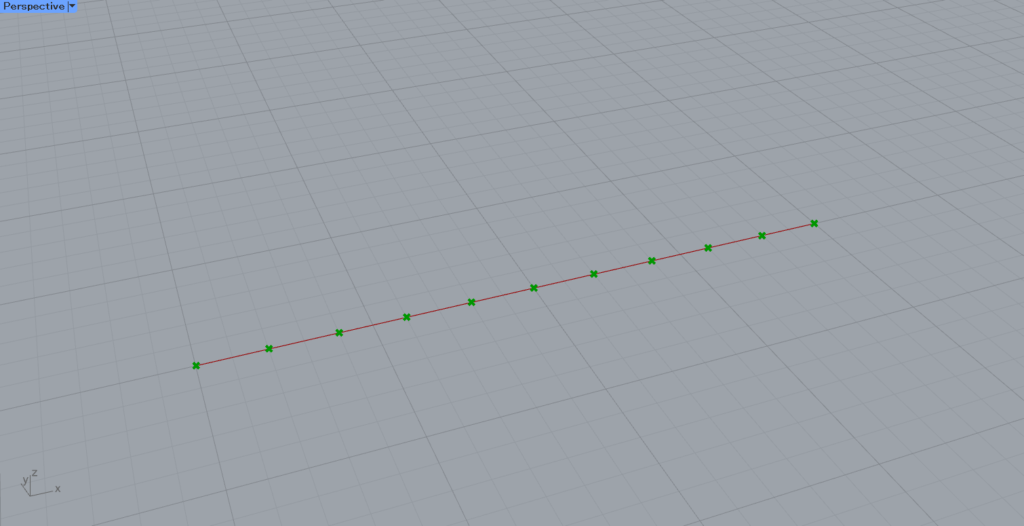
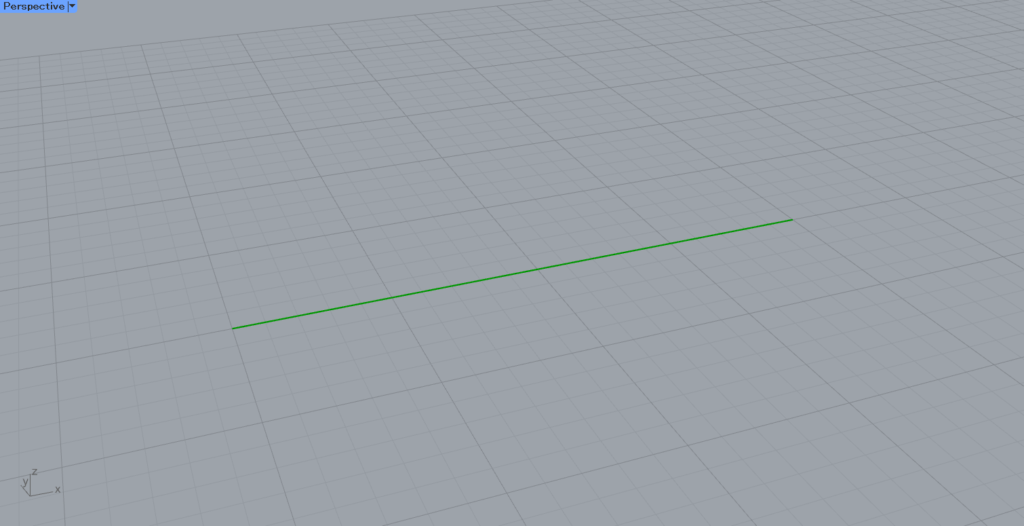
As shown in the image above, the line is now divided by points.
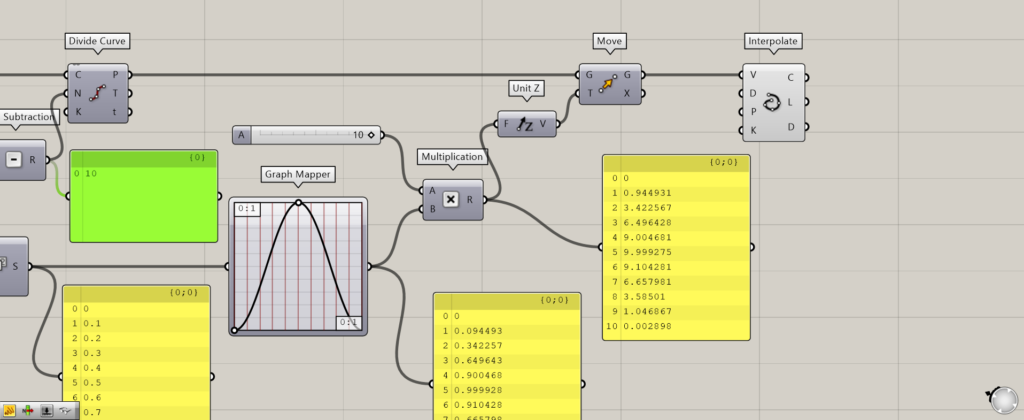
Then, connect Graph Mapper to Multiplication and an appropriate numerical value, and multiply the result.
This appropriate number is a magnification factor, so you can adjust the distance to be moved by changing the value.
In this case, 10 is entered.
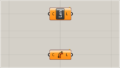
Then, connect Multiplication to Unit Z, and connect it to the Move(T).
In addition, connect Divide Curve to Move(G).
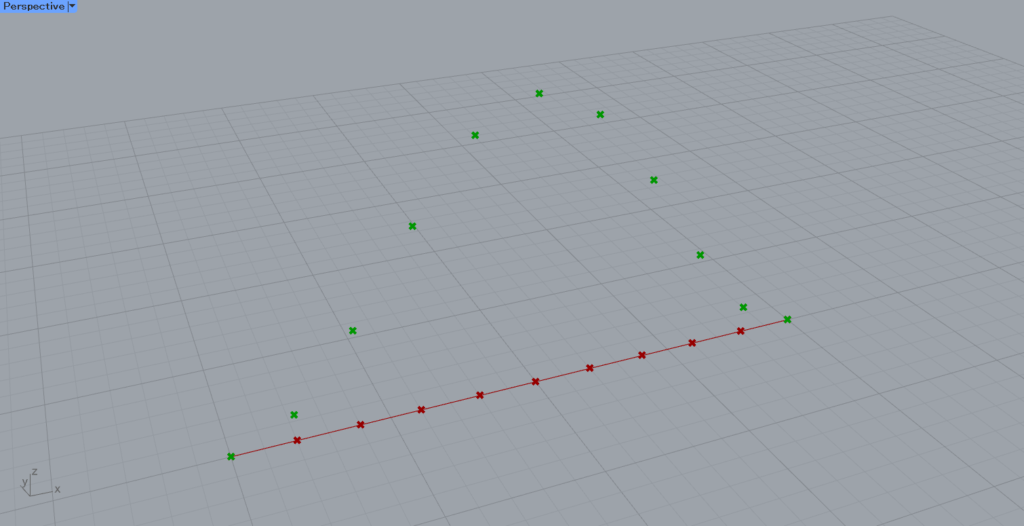
As you can see, the points have moved according to the shape of the graph.
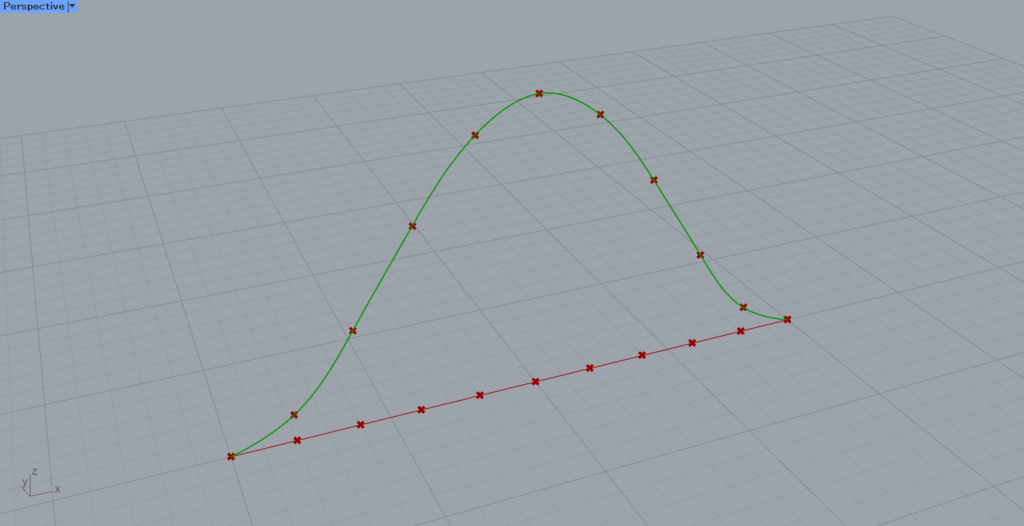
Finally, by using Interpolate, a curve connecting the points was created.
The curve is now complete.
Let’s change the shape of the graph.
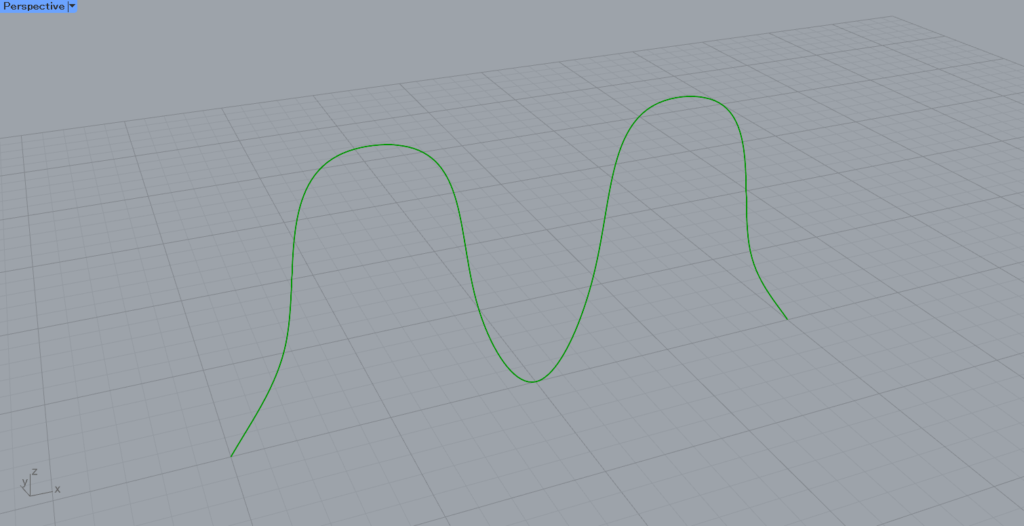
The shape of the graph has changed as shown here.
List of Grasshopper articles using Graph Mapper component↓

Comment