
![[Grasshopper]格子線を滑らかなパイプでつなぐ+部分削除[データも配布]](https://iarchway.com/wp-content/uploads/2025/02/eyecatch_web-9.jpg)
In this article, we will explain how to connect the grid lines with smooth pipes using Grasshopper, and how to delete the area around the specified point’s attractor.
Video
Model Images
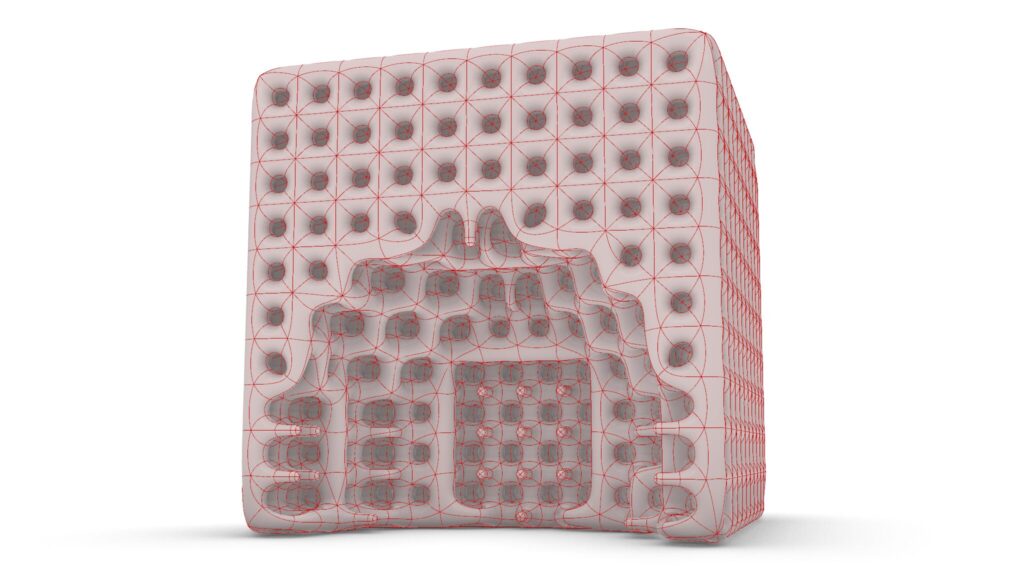
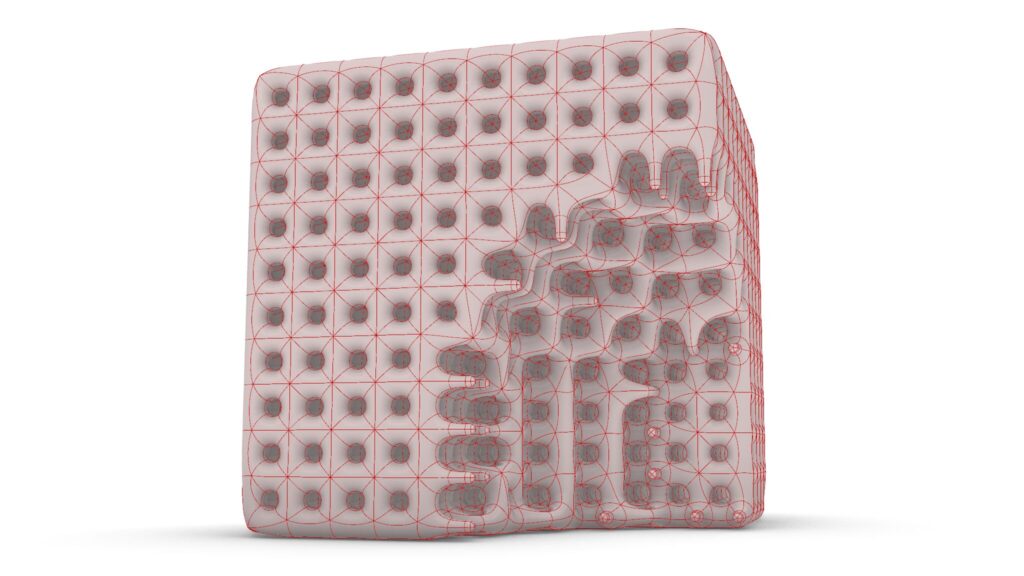
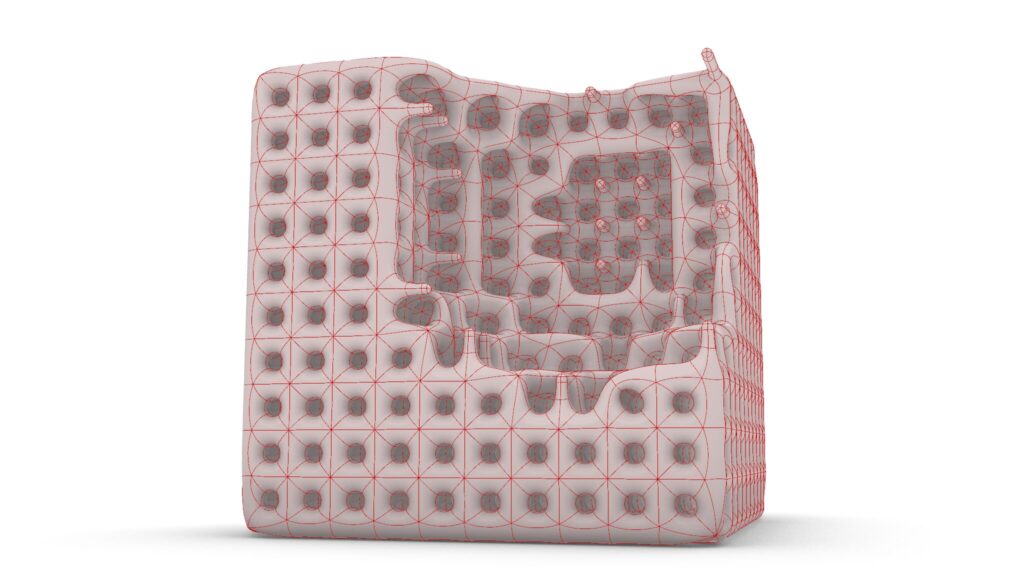
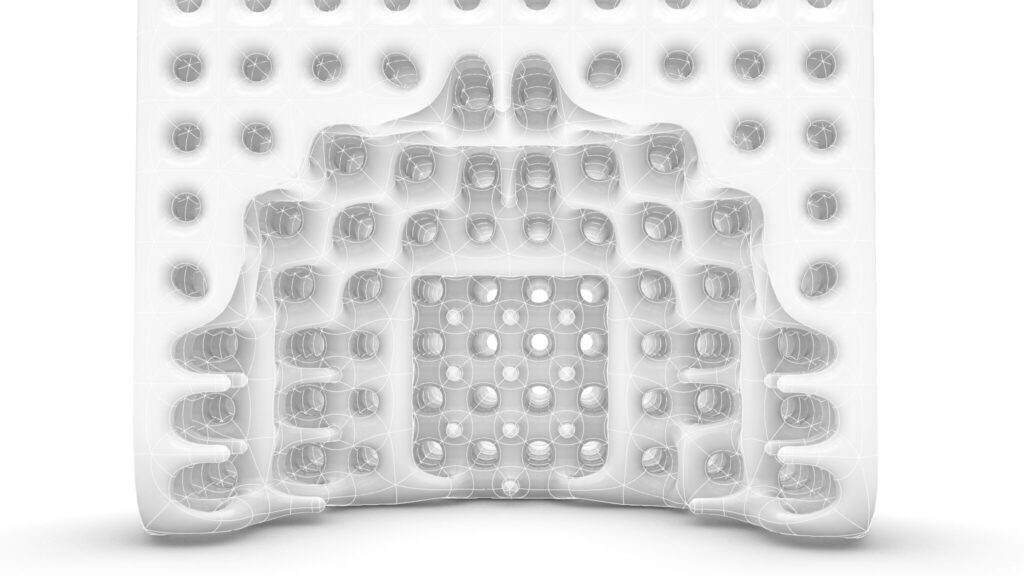
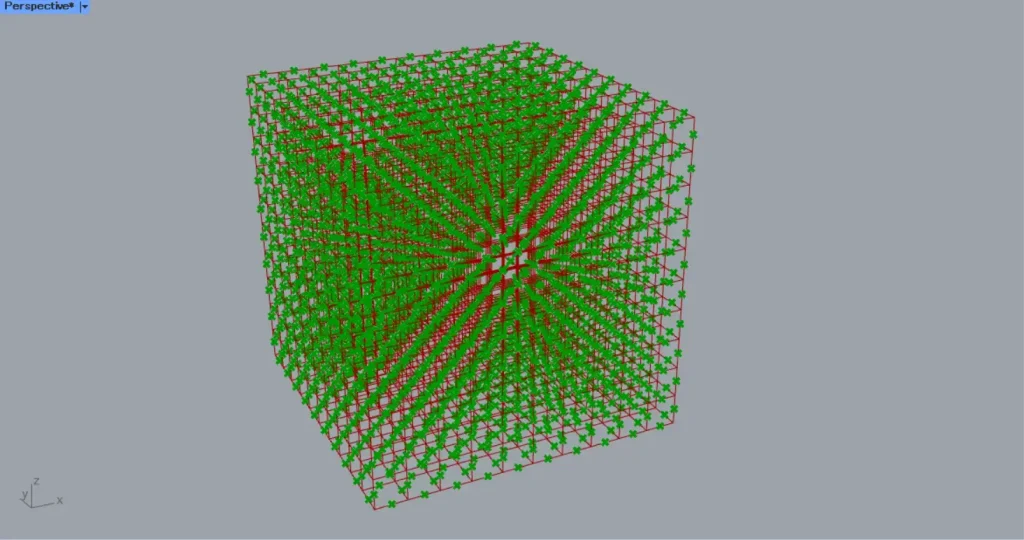
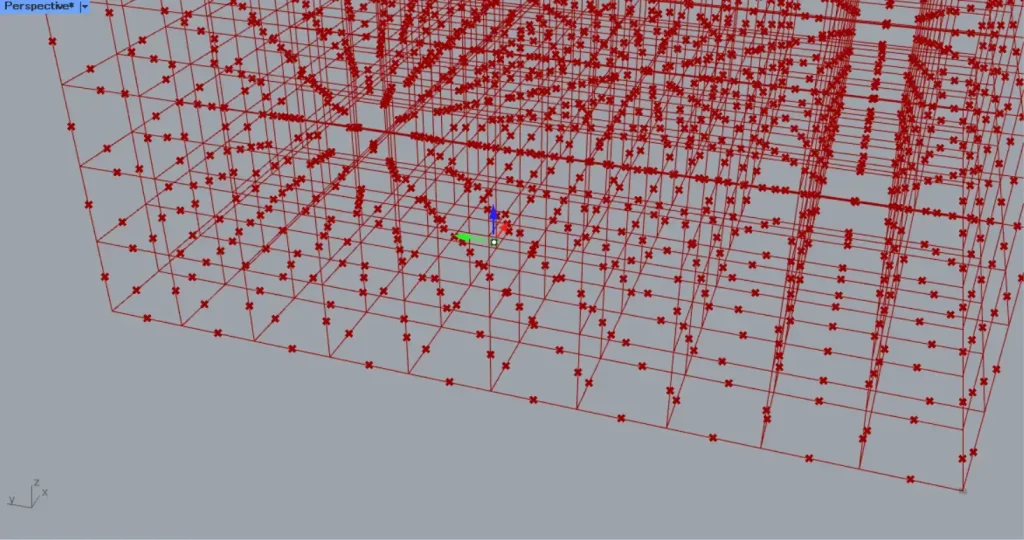
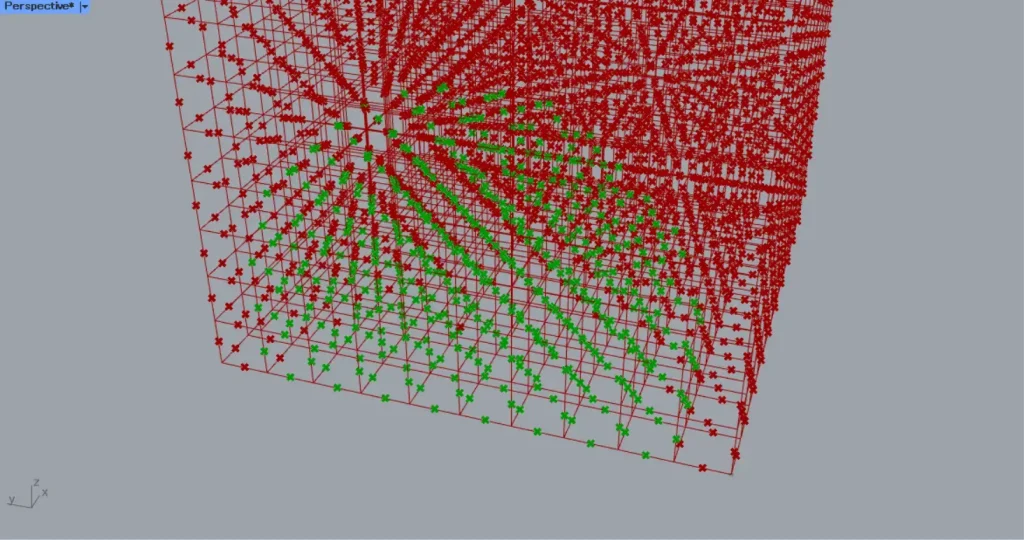
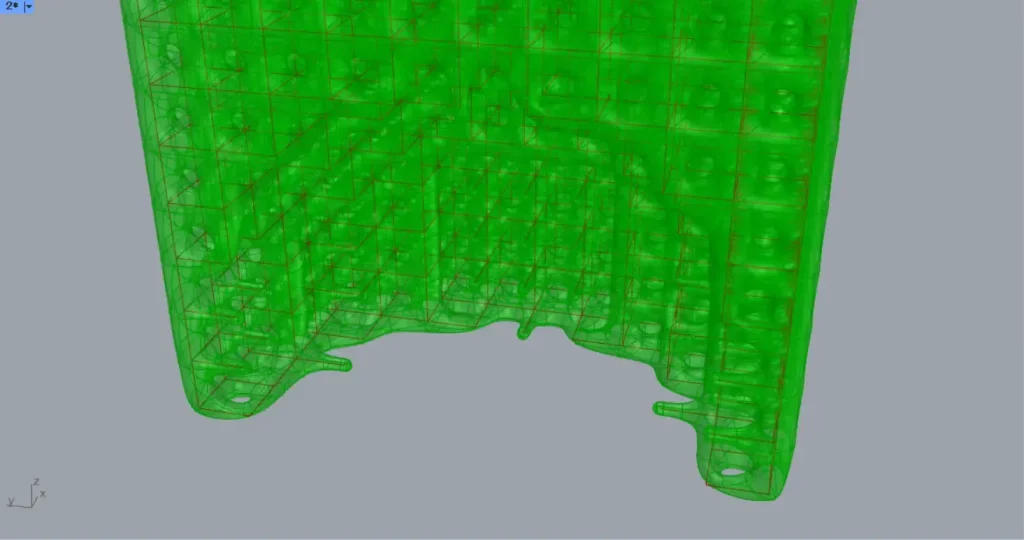
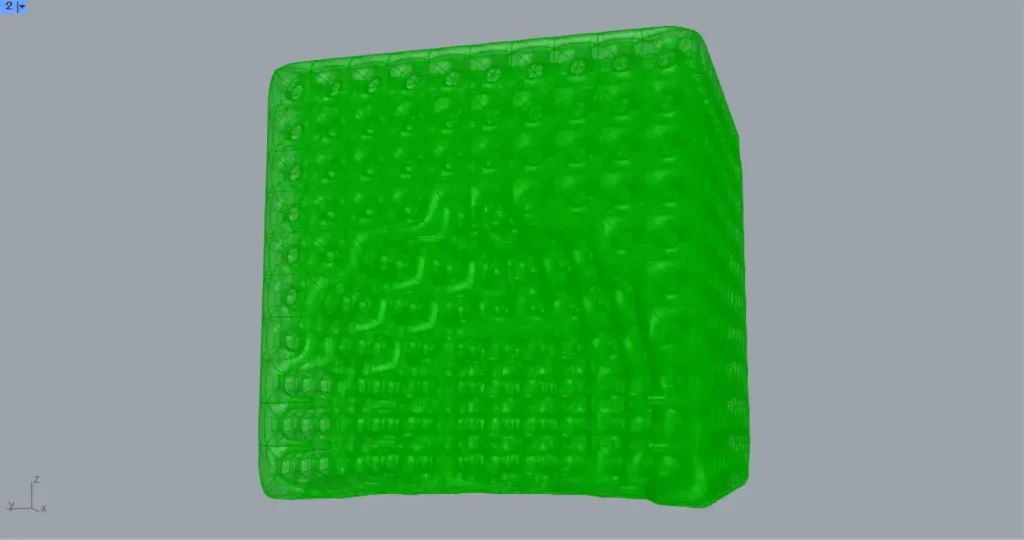
The top three images show the attractor in different positions.
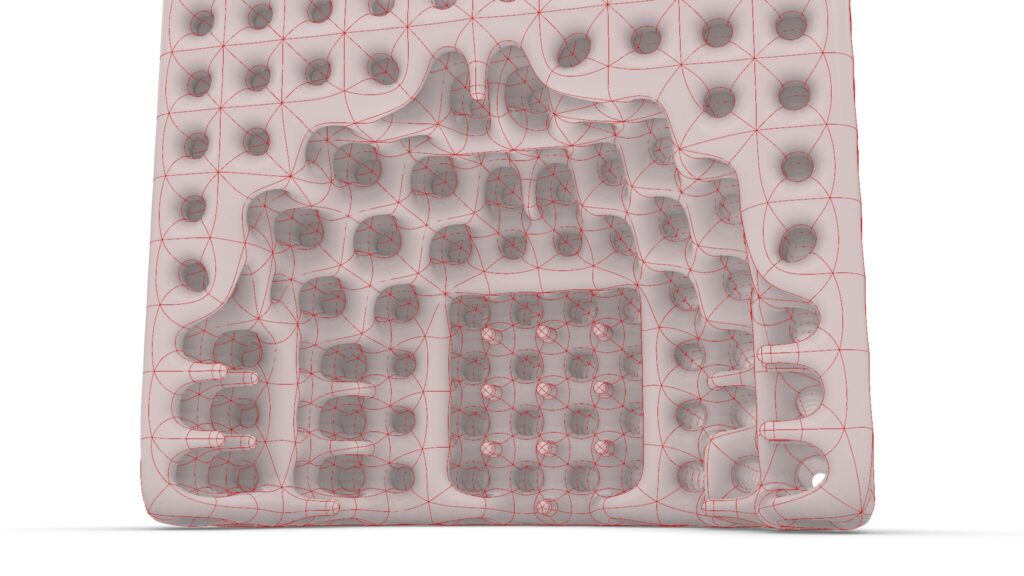
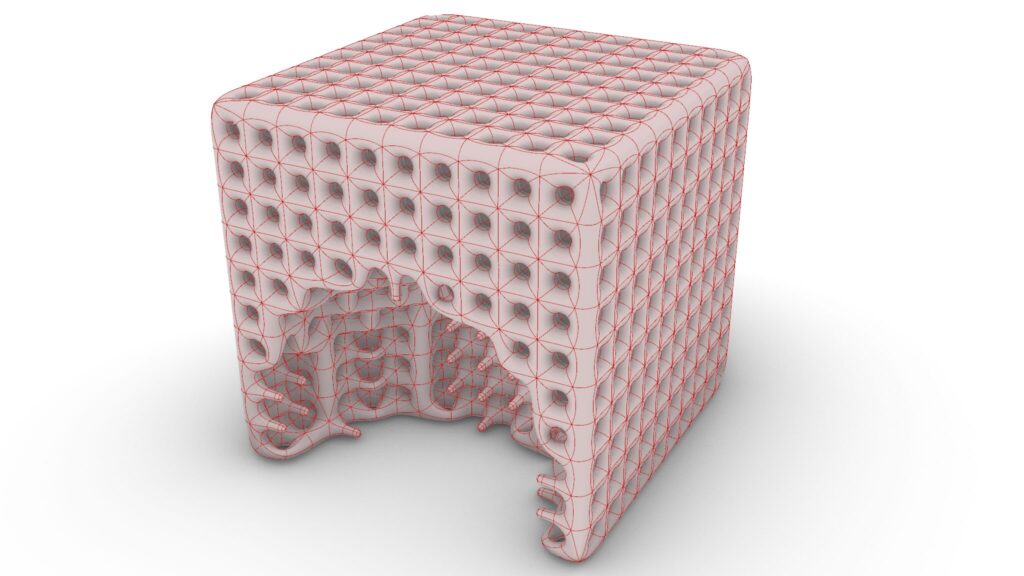
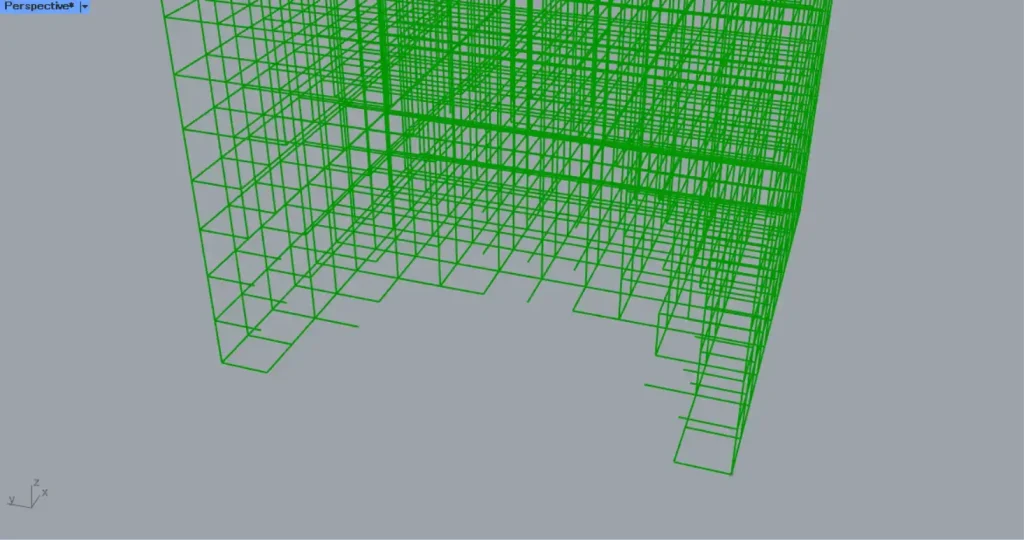
The top three images are from Grasshopper.
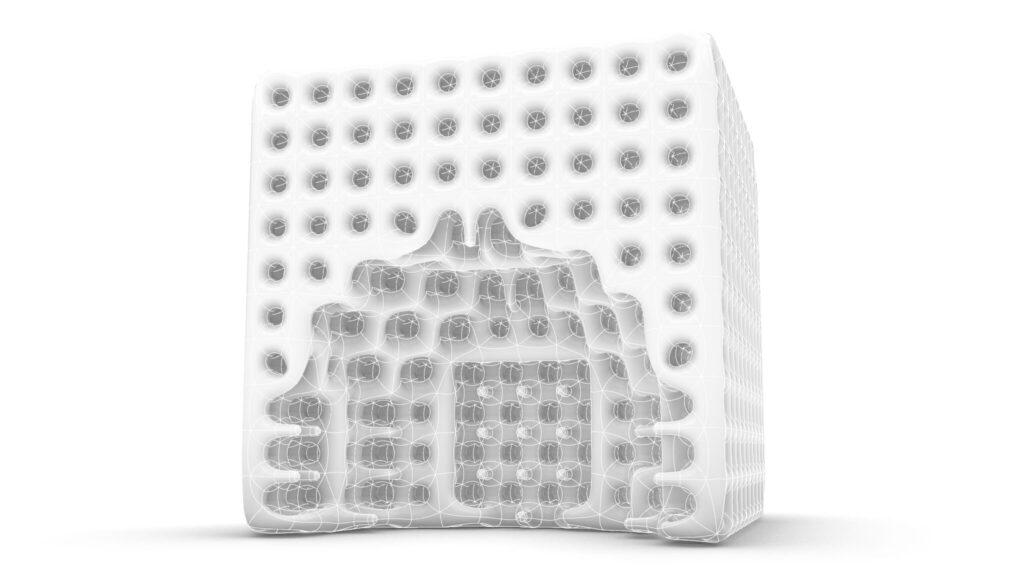
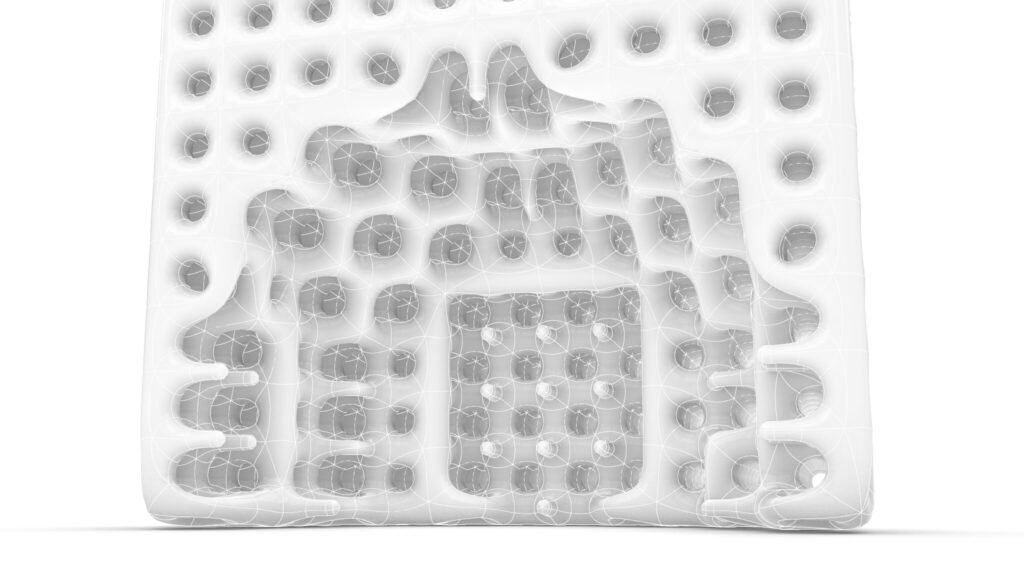
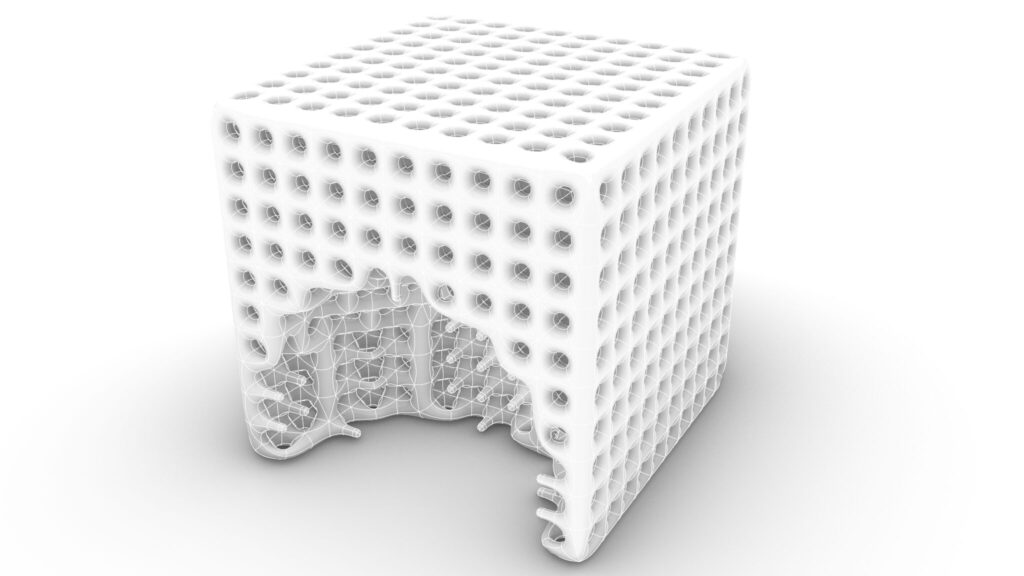
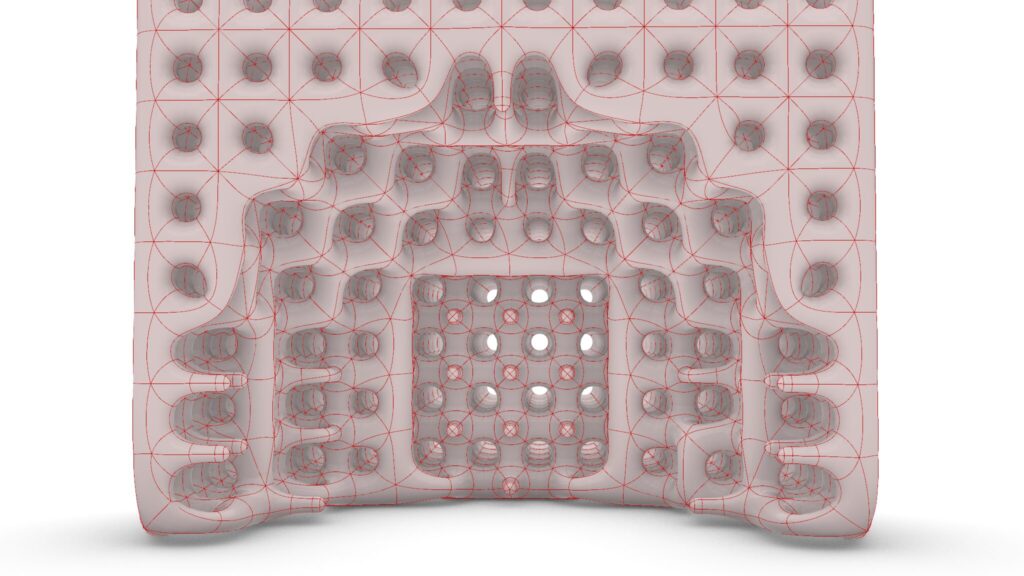
The top four images show the model exported on Rhinoceros.
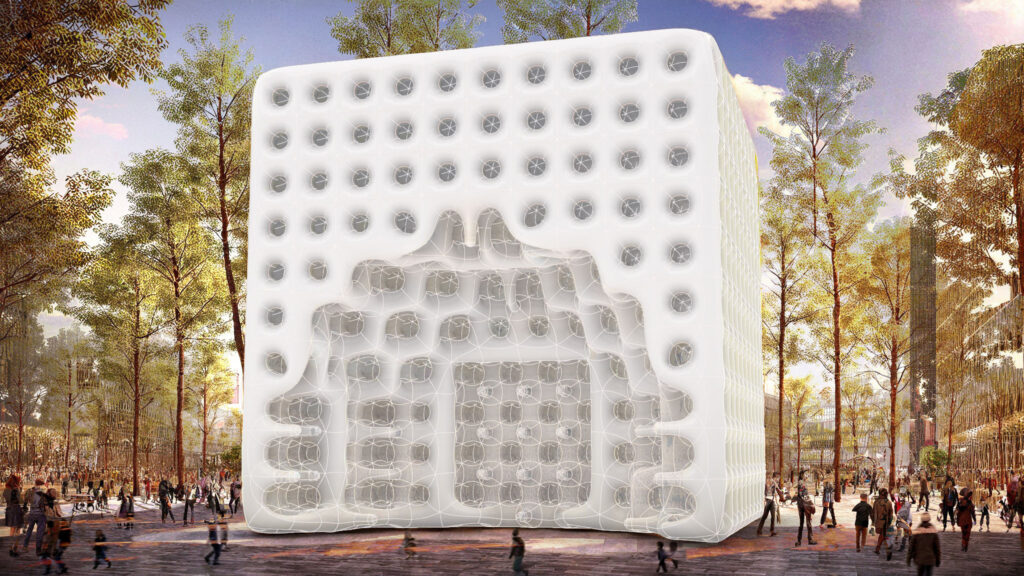
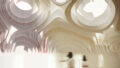
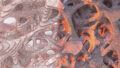
The image above shows the final rendering.
Click here to download the Grasshopper file
Please refer to the Terms of Use regarding the use of downloadable data.
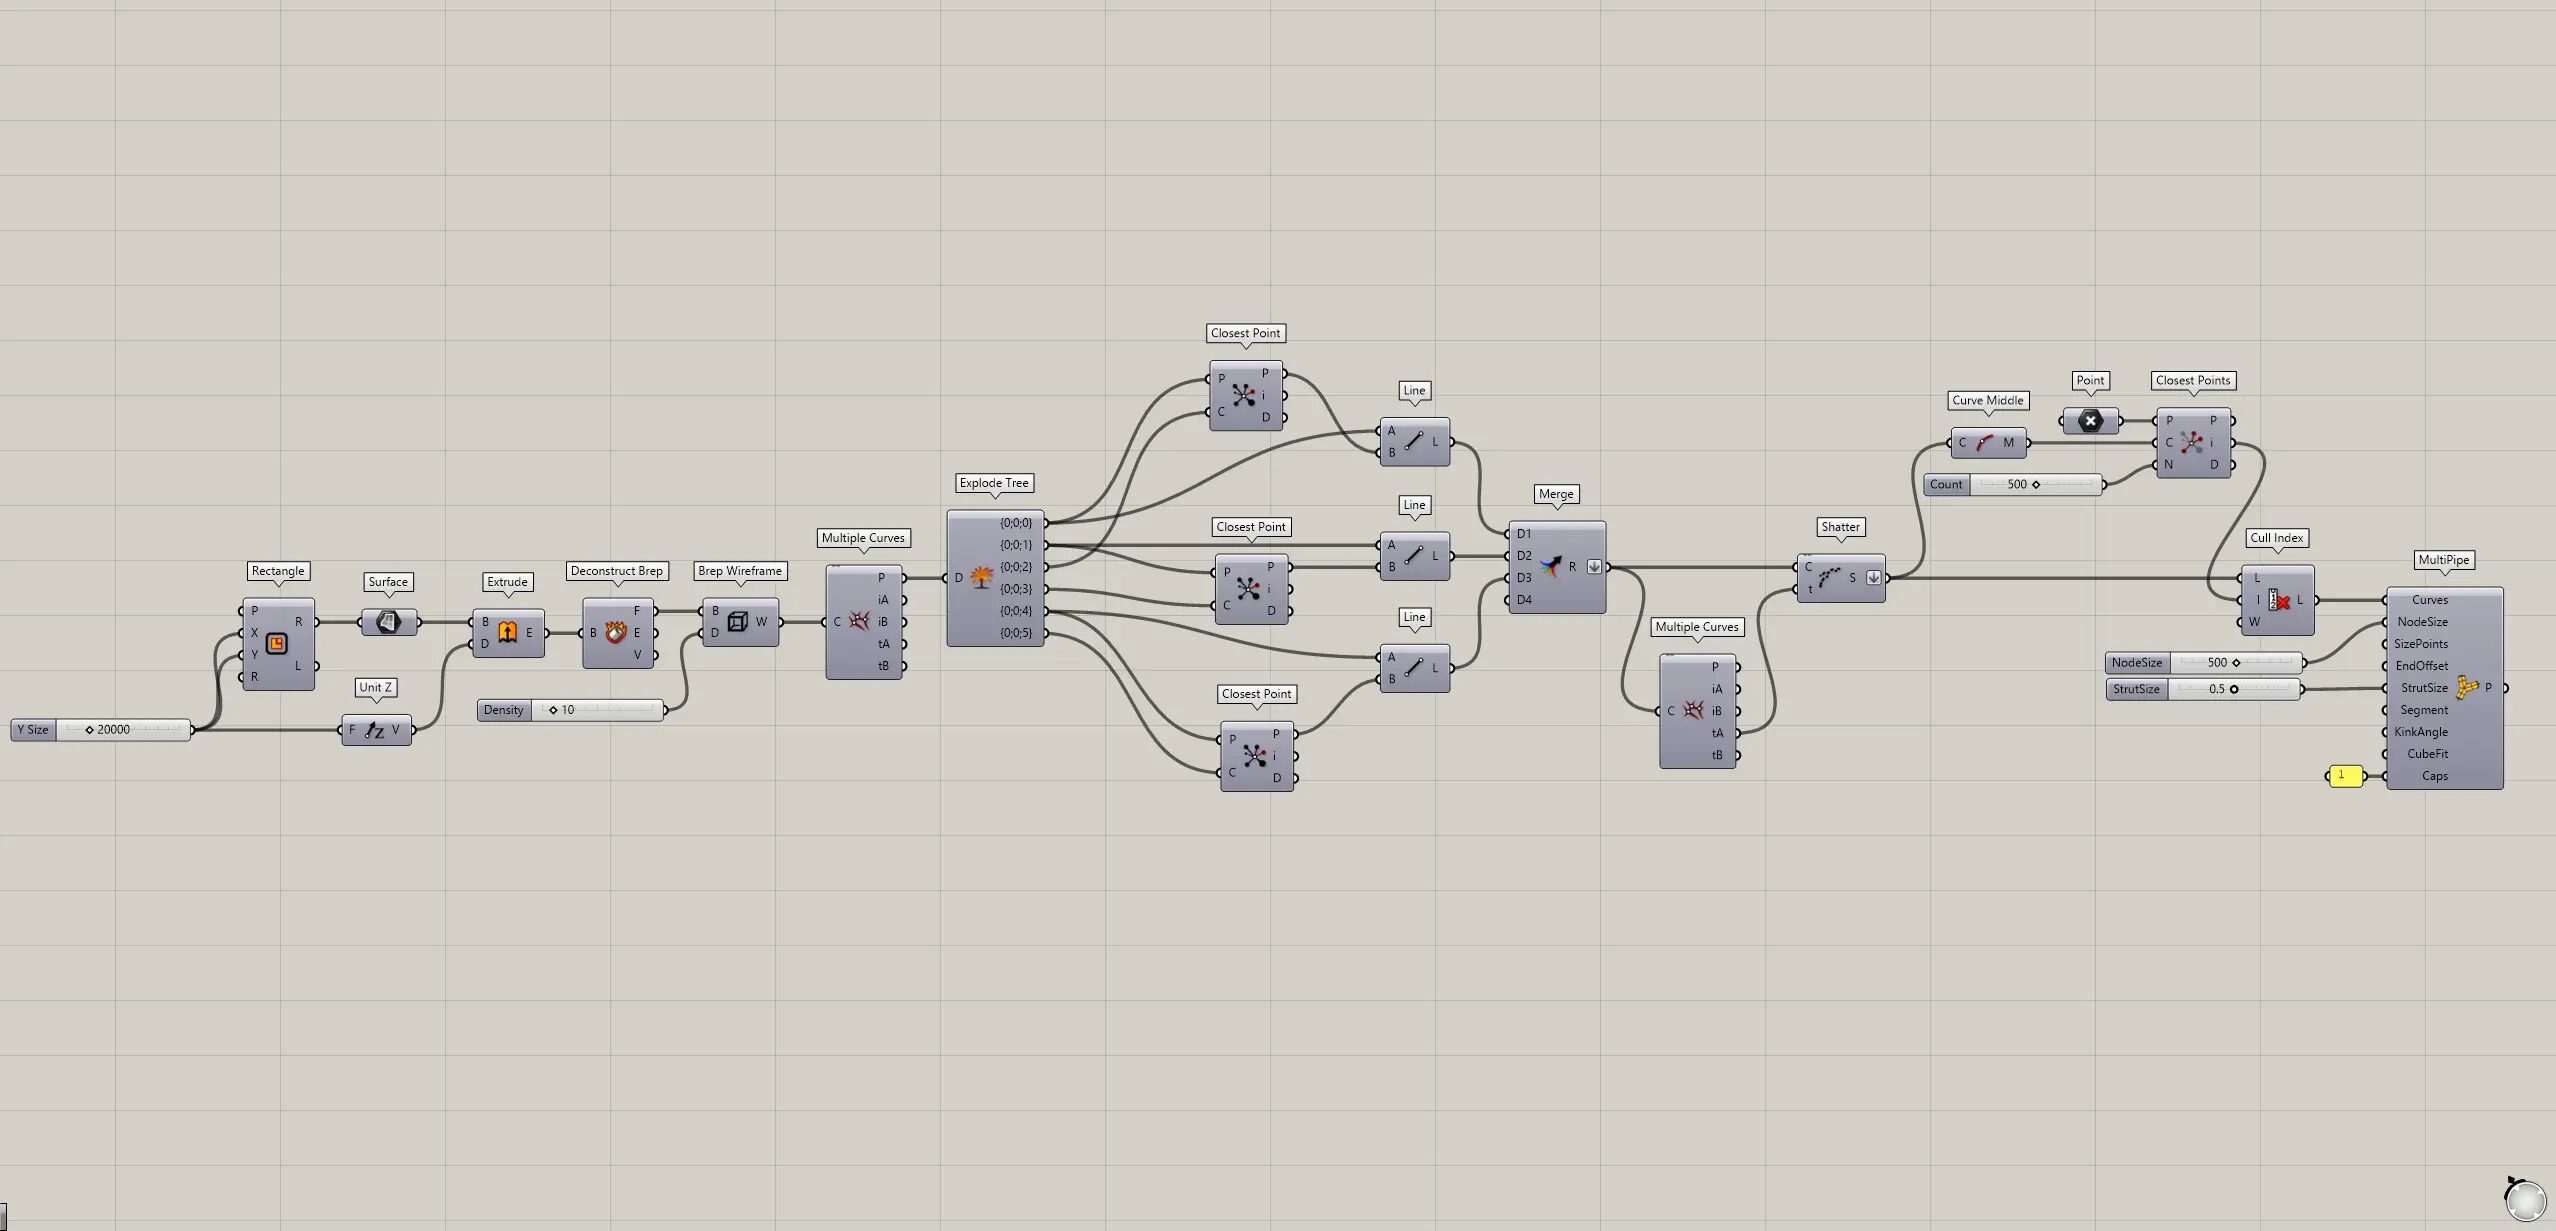
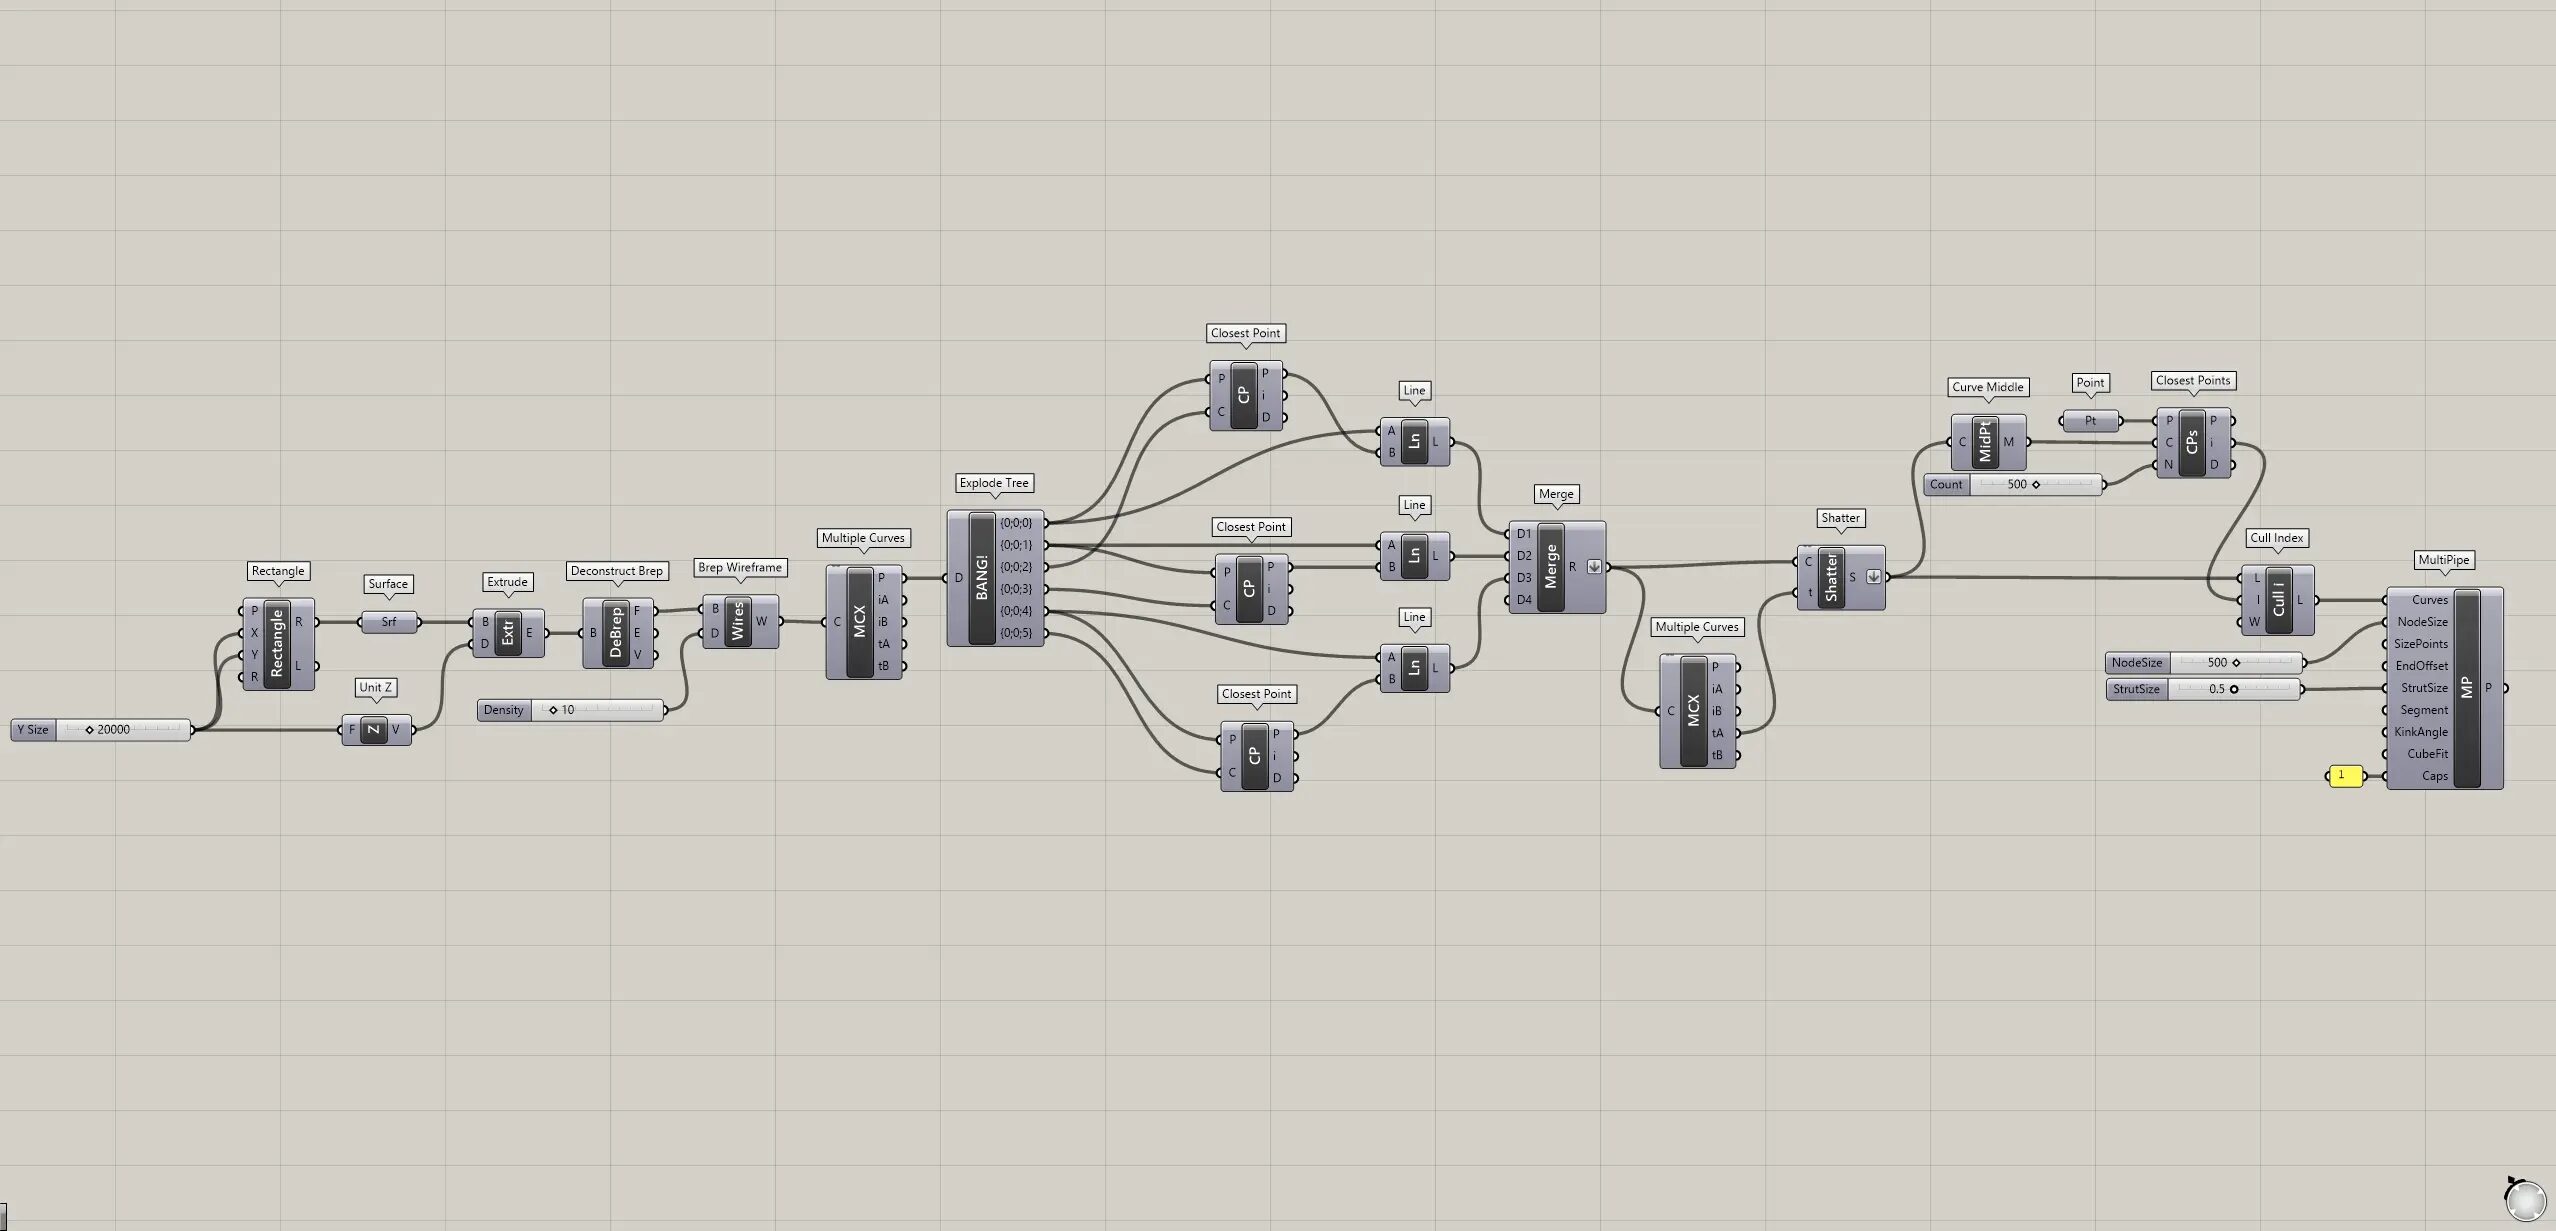
Grasshopper recipe
①Rectangle ②Surface ③Unit Z ④Extrude ⑤Deconstruct Brep ⑥Brep Wireframe ⑦Multiple Curves ⑧Explode Tree ⑨Closest point ⑩Line ⑪Merge ⑫Shatter ⑬Curve Middle ⑭Point ⑮Closest Points ⑯Cull Index ⑰MultiPipe
Grid lines
First, we create grid lines.
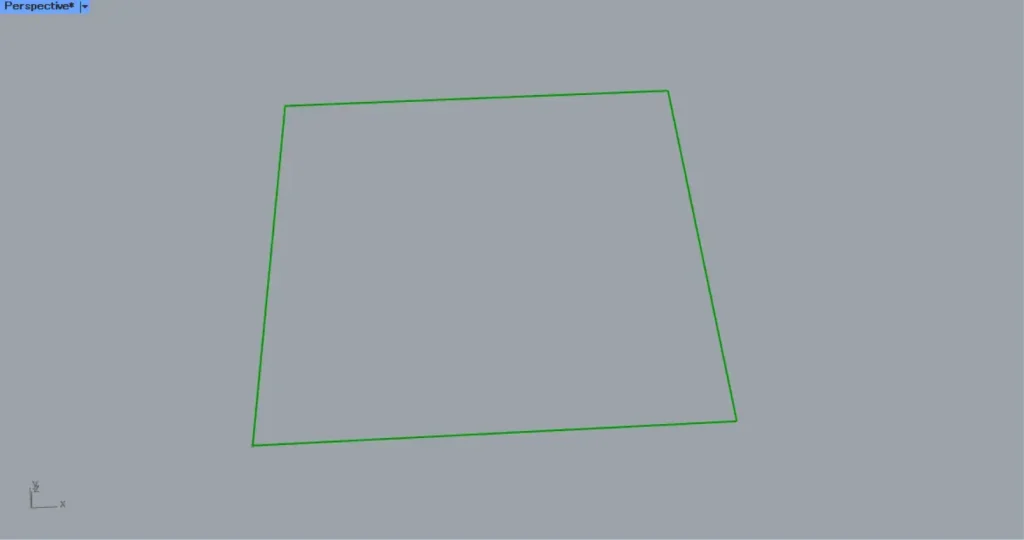
In a Rectangle(X and Y), enter the values for the lengths of the sides.
This time, connect 2000 to both.
Then a square line is created, as shown in the image above.
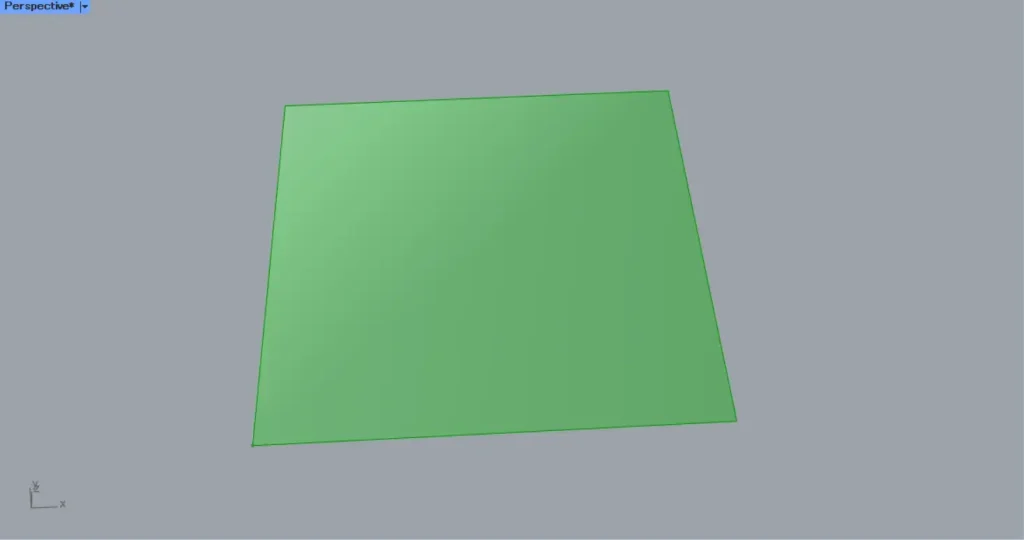
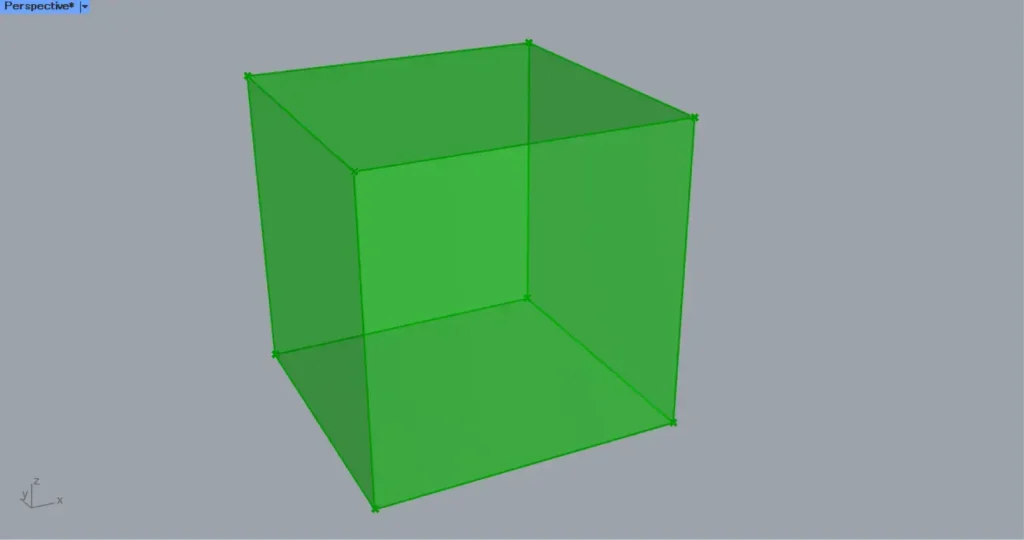
Then connect the Rectangle(R) to a Surface.
Then a surface is created from the lines, as in the image above.
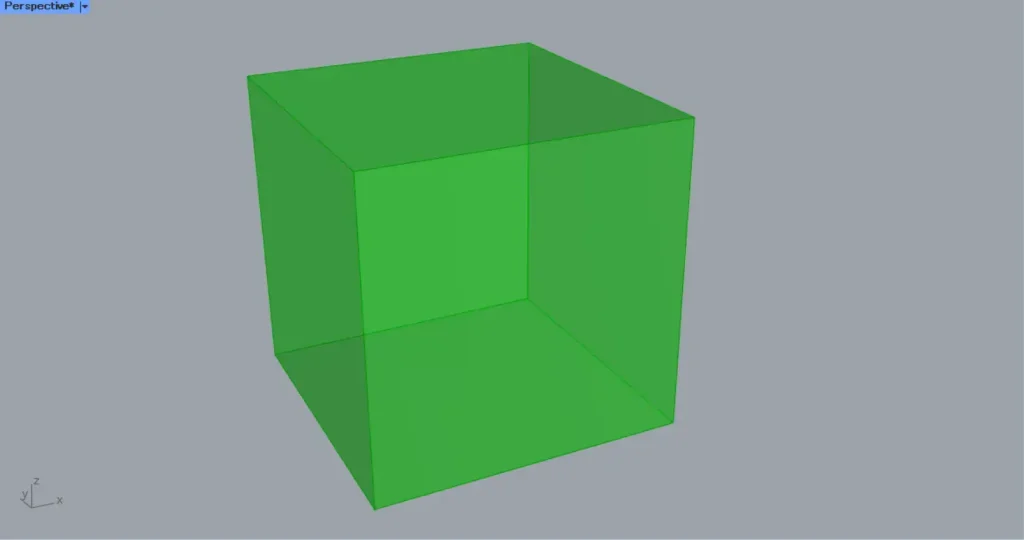
Then connect 20000 from earlier to an Unit Z.
In addition, connect the Unit Z to an Extrude(D).
In addition, connect the Surface to the Extrude(B).
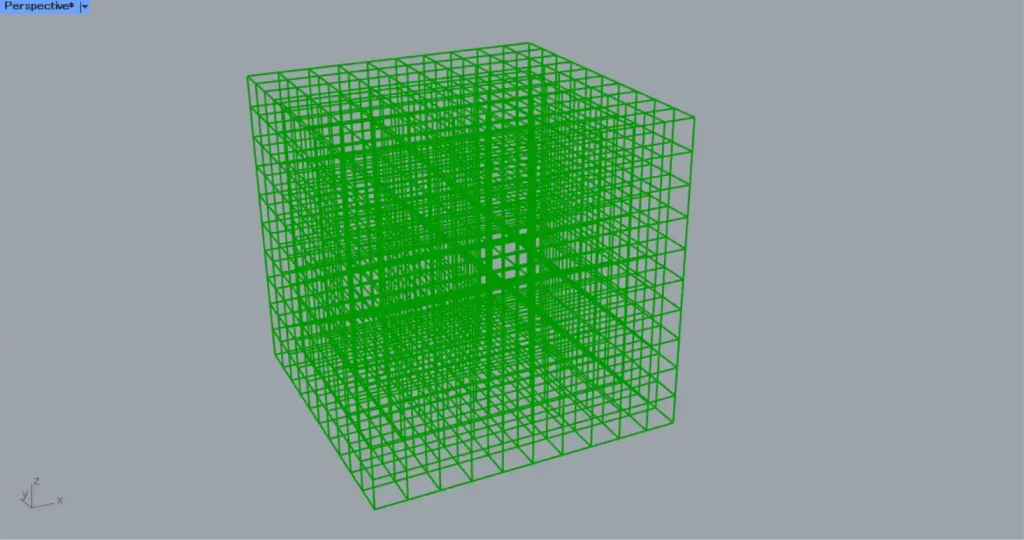
Then a cube is created, as shown in the image above.
Then connect the Extrude to a Deconstruct Brep.
Then the cube is decomposed and you get 6 faces.
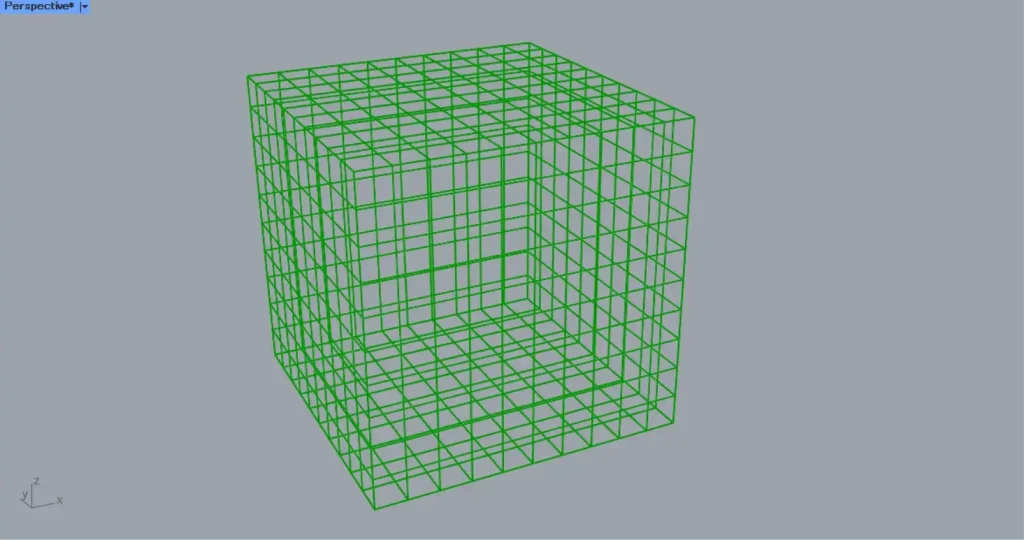
Then connect the Deconstruct Brep(F) to a Brep Wireframe(B).
In addition, connect the number of divisions to the Brep Wireframe(D).
Then straight lines are created to divide each face into 10 x 10 pieces, as shown in the image above.
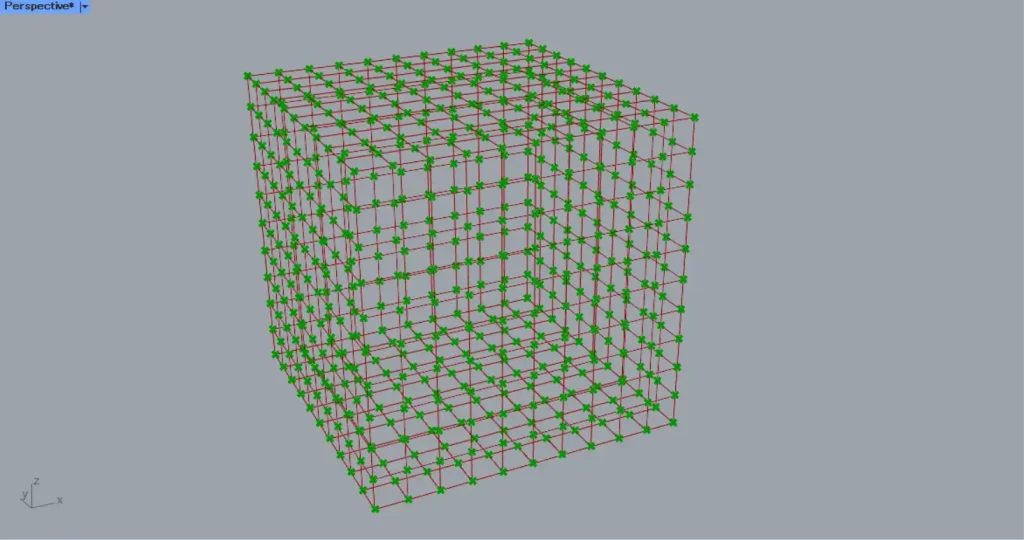
Then connect the Brep Wireframe to a Multiple Curves.
Then you can get the intersection points of the lines, as in the image above.
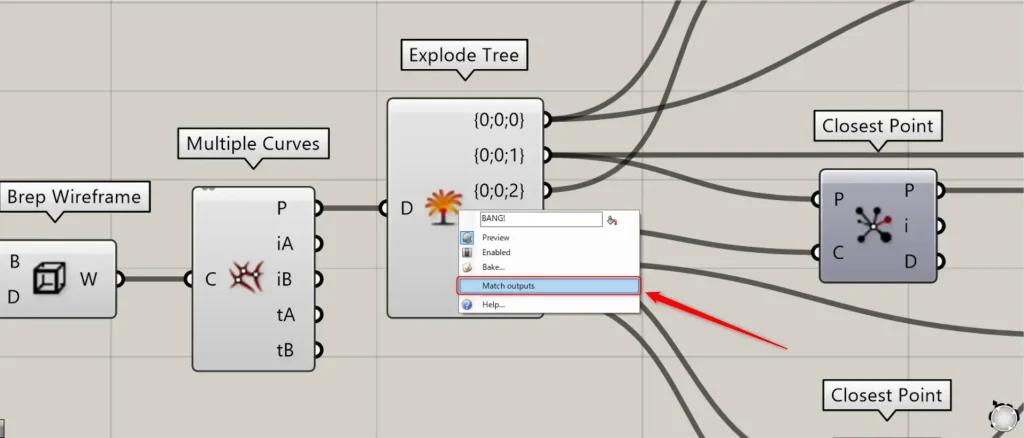
Then connect the Multiple Curves(P) to an Explode Tree.
At this point, right click on the Explode Tree and select Match outputs.
Then 6 terminals are created on the right side, which is the number of faces.
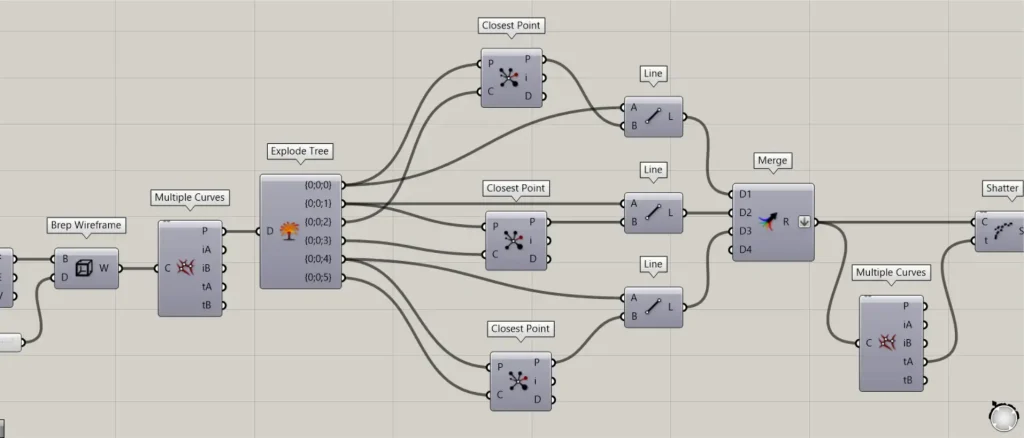
Then place three Closest Point and Line.
And connect them as shown in the image above.

This will create lines connecting points in opposite directions, as shown in the image above.
Then connect the three Line to a Merge.
Now you can combine the line data into one.
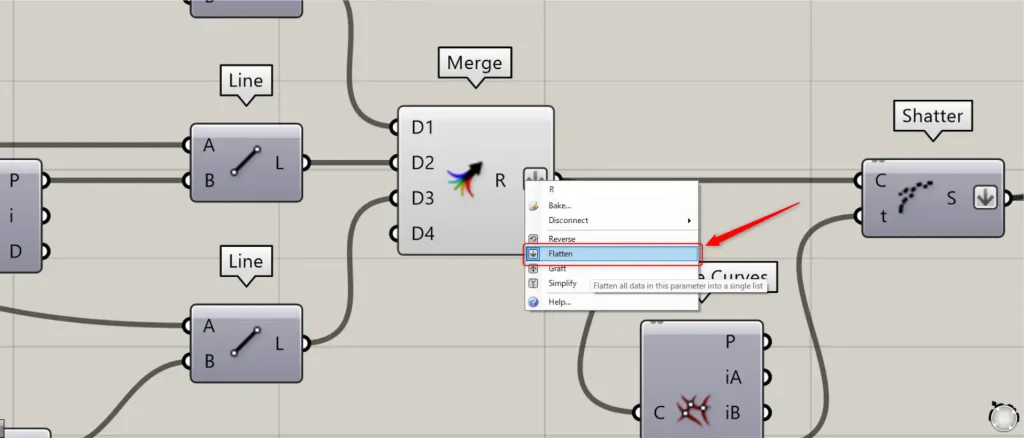
At this point, right click on the Merge(R) and set Flatten.
Then connect the Merge to a Multiple Curves.
Then you can get information on where the lines intersect.

Then connect the Multiple Curves(tA) to a Shatter(t).
In addition, connect the Merge to a Shatter(C).
Then the lines will be split at the point where they intersect, as shown in the image above.
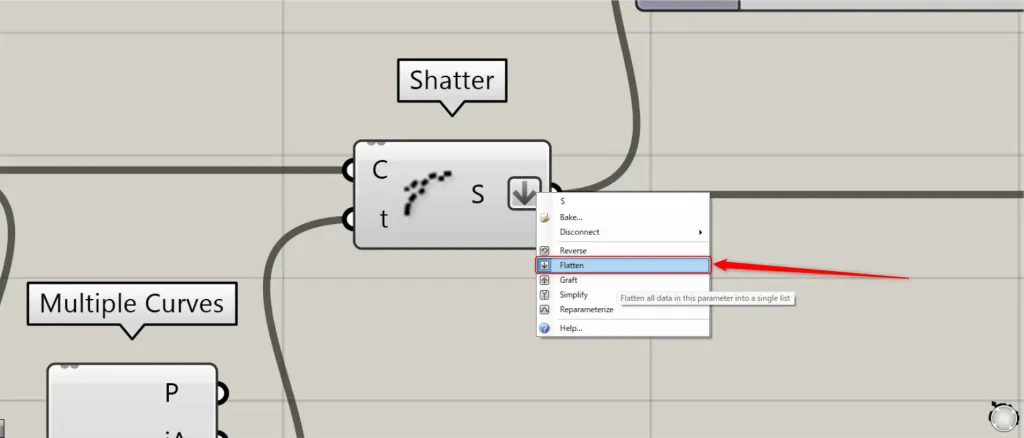
At this point, right click on the Shatter(S) and set Flatten.
This completes the creation of the grid lines.
Then connect the Shatter to a Curve Middle.
Then the midpoint of each line is retrieved.
Then create any attractor point.
This time, the point is stored in Point.
Connect the Point to a Closest Points(P).
In addition, connect the Curve Middle to the Closest Points(C).
In addition, connect the number of points to be retrieved to the Closest Points(N).
This time, we are connecting 500.
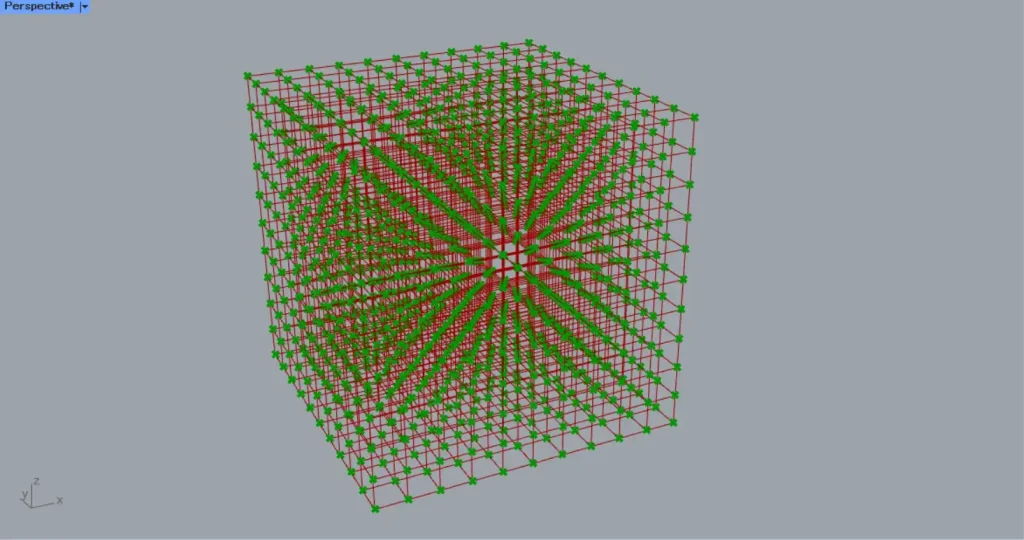
Then we can get information about the points around the attractor point, as shown in the image above.
Then connect the Closest Points(i) to a Cull Index(I).
In addition, connect the Shatter to a Cull Index(L).
Then the lines corresponding to the acquired midpoints are removed, as shown in the image above.
Then connect the Cull Index to a MultiPipe(Curves).
Furthermore, connect the numerical value of the size of the joins to MultiPipe(NodeSize).
Furthermore, connect the numerical value of the magnification factor for the middle size of the join to MultiPipe(StrutSize).
In addition, connect 1 to MultiPipe(Caps).
This will create a smooth pipe with rounded corners, as shown in the image above.
This completes the process.
That’s all.

Comment