
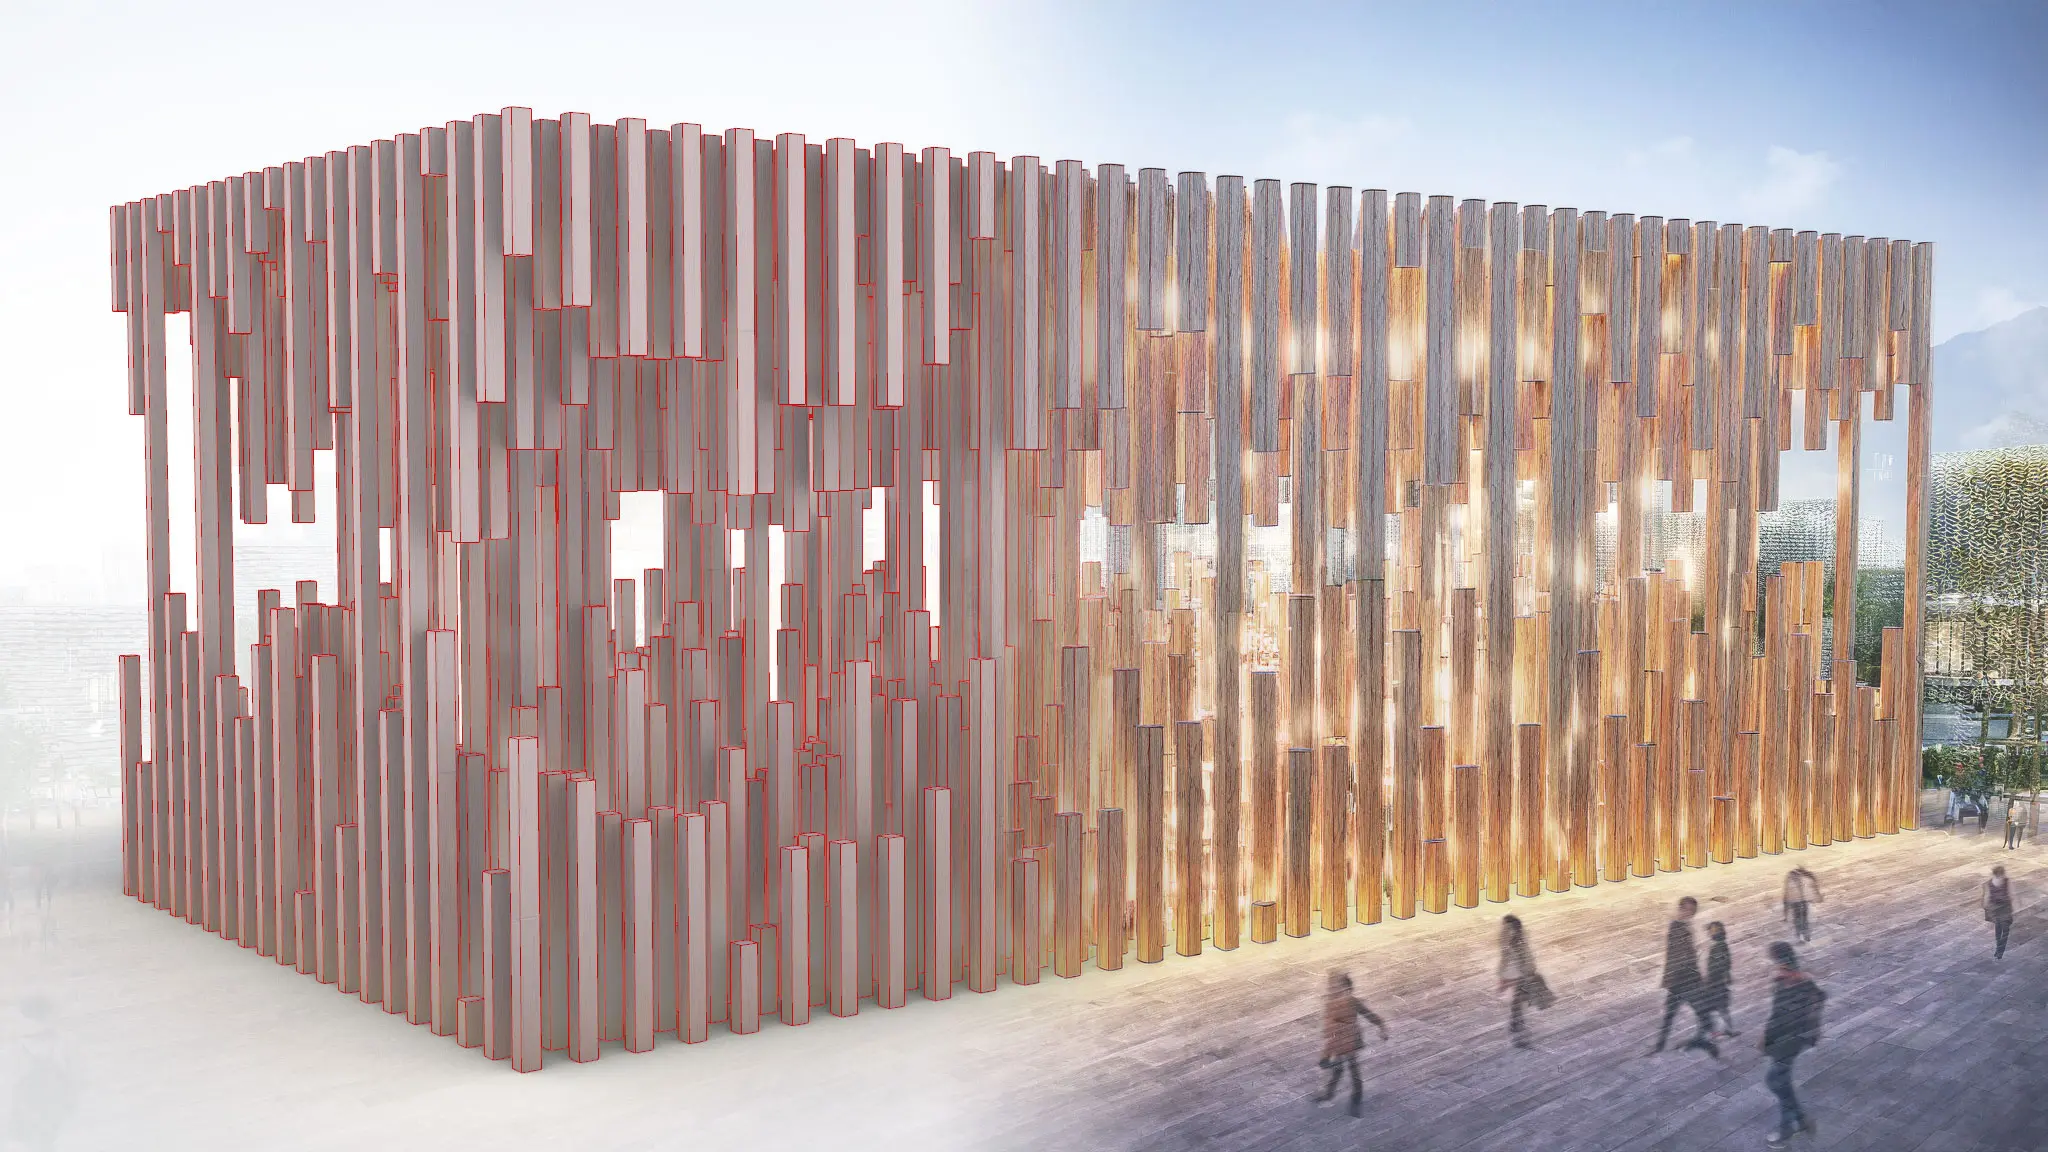
This article describes Limestone Cave Pavilion using Grasshopper.
The Grasshopper file used in this project is also available for download.
Video
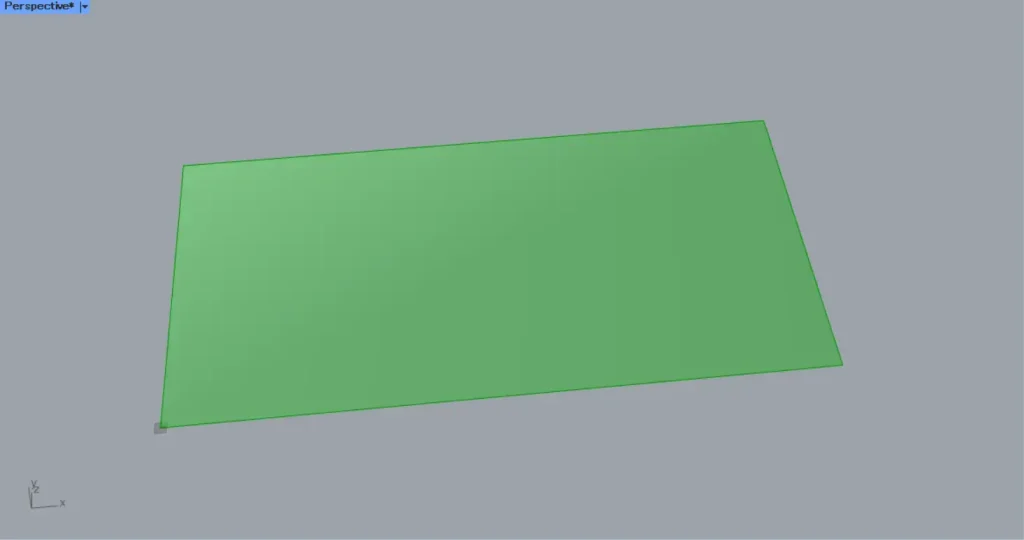
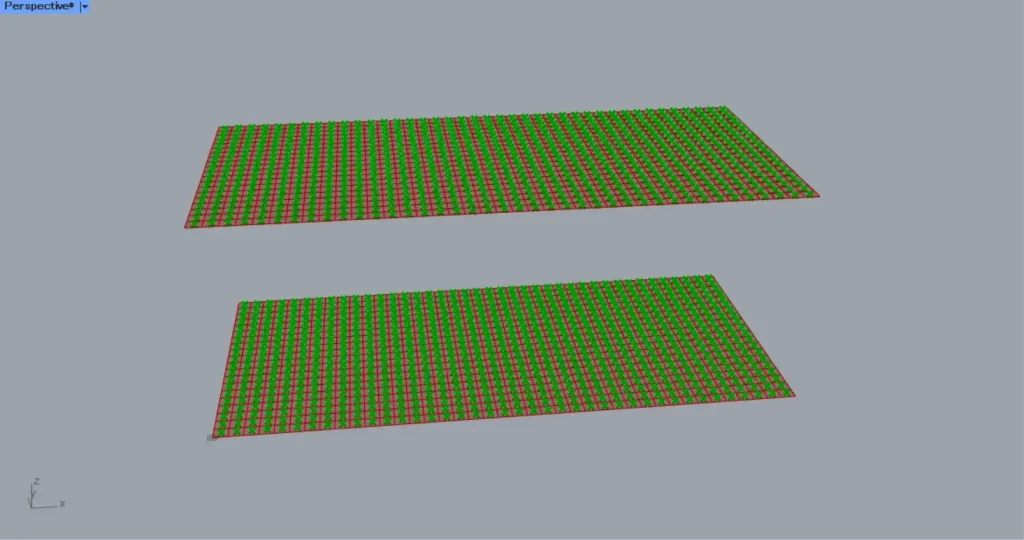
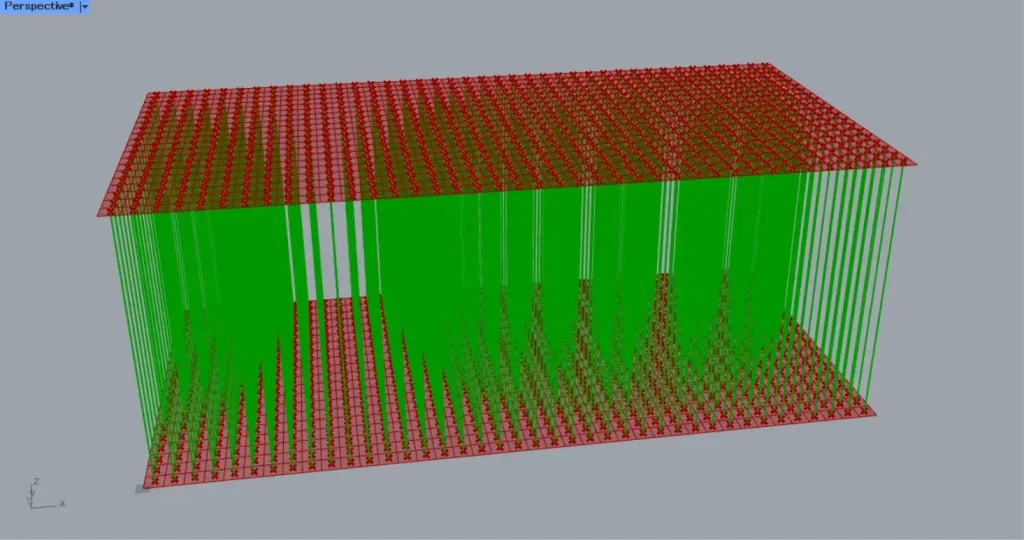
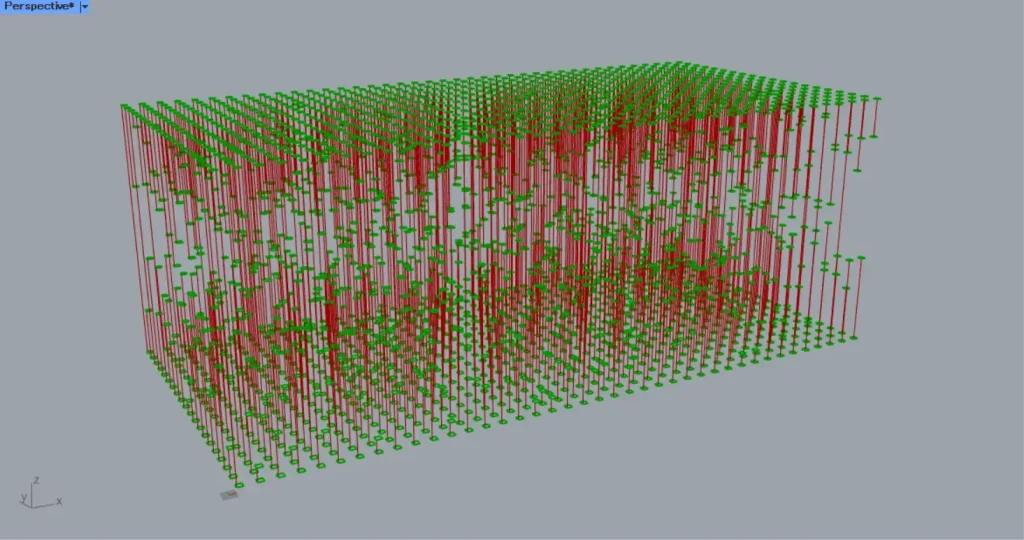
Model Images
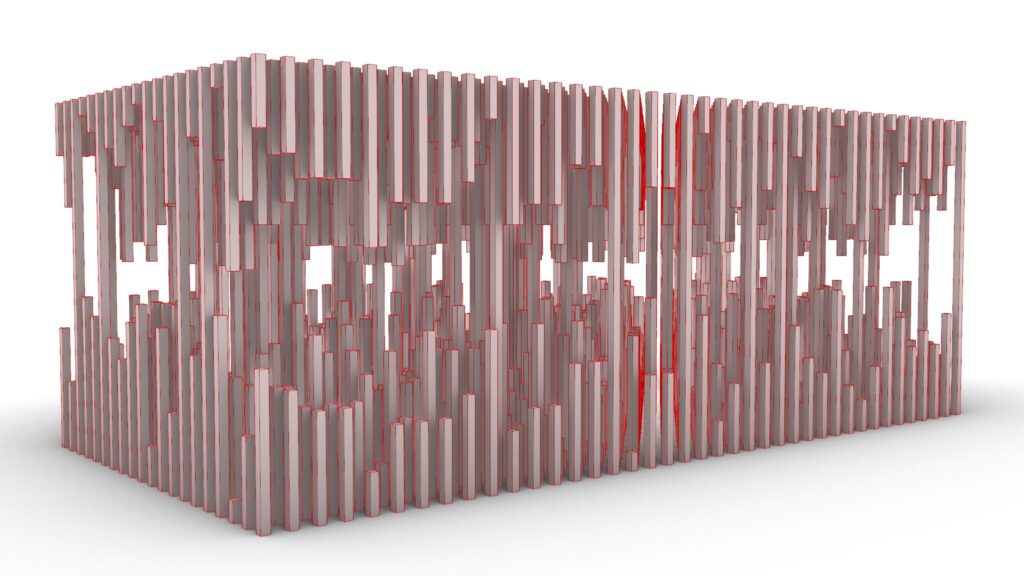
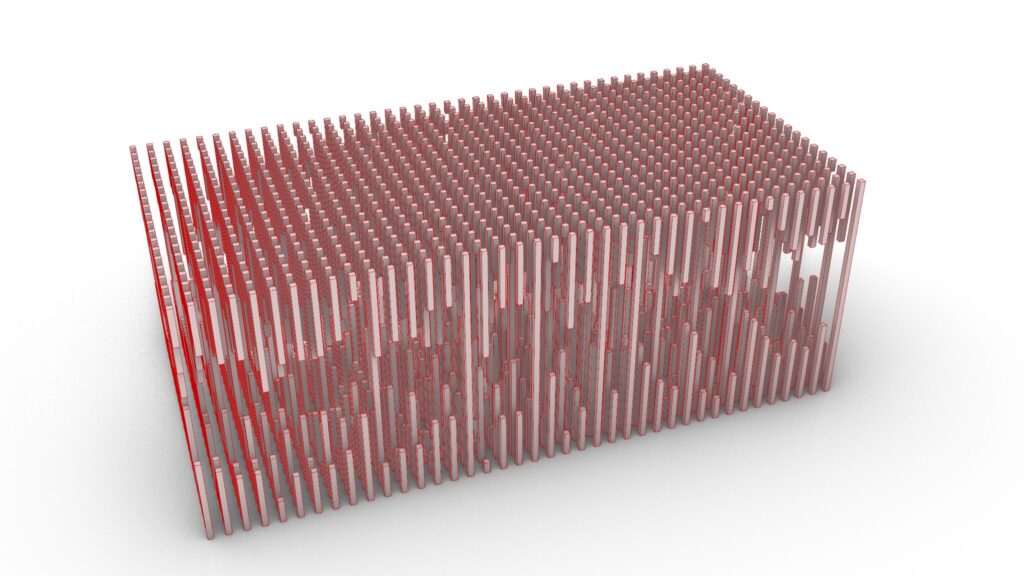
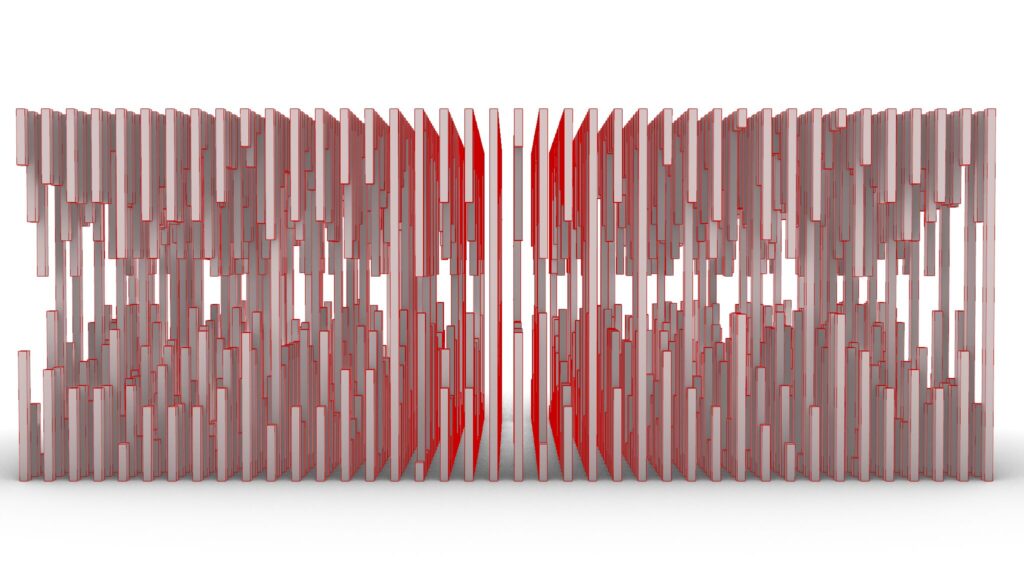
The top four images are from Grasshopper.
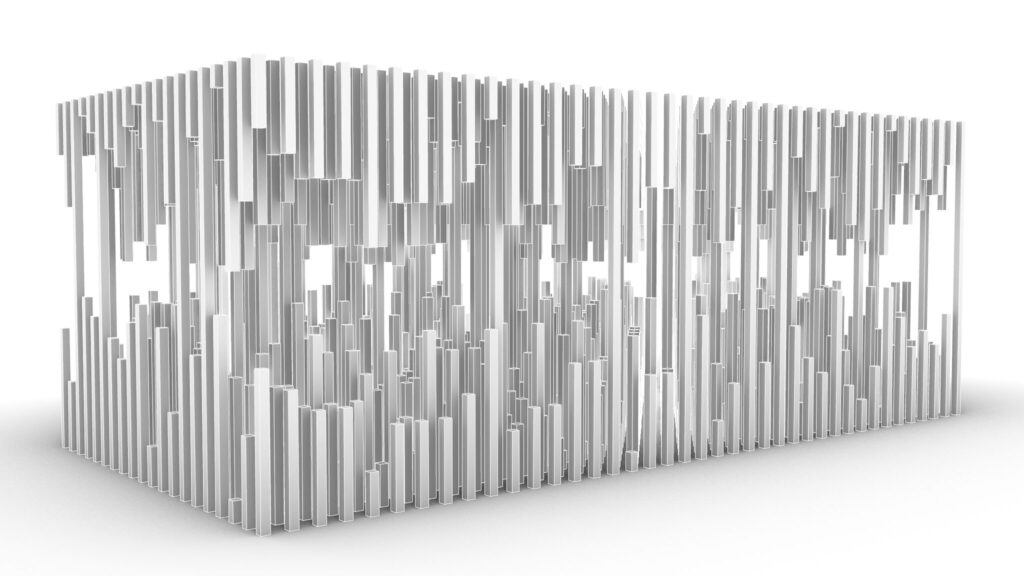
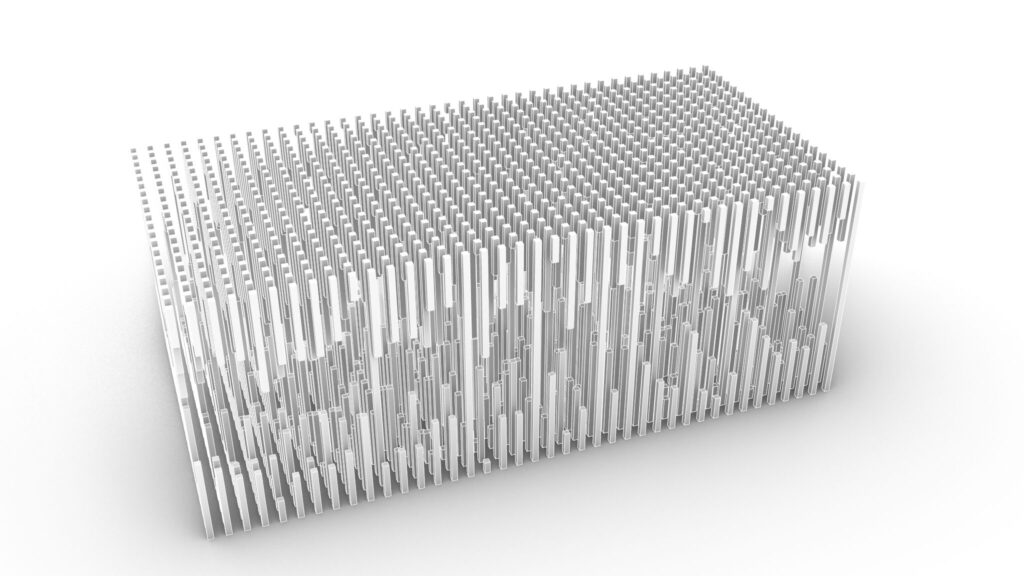
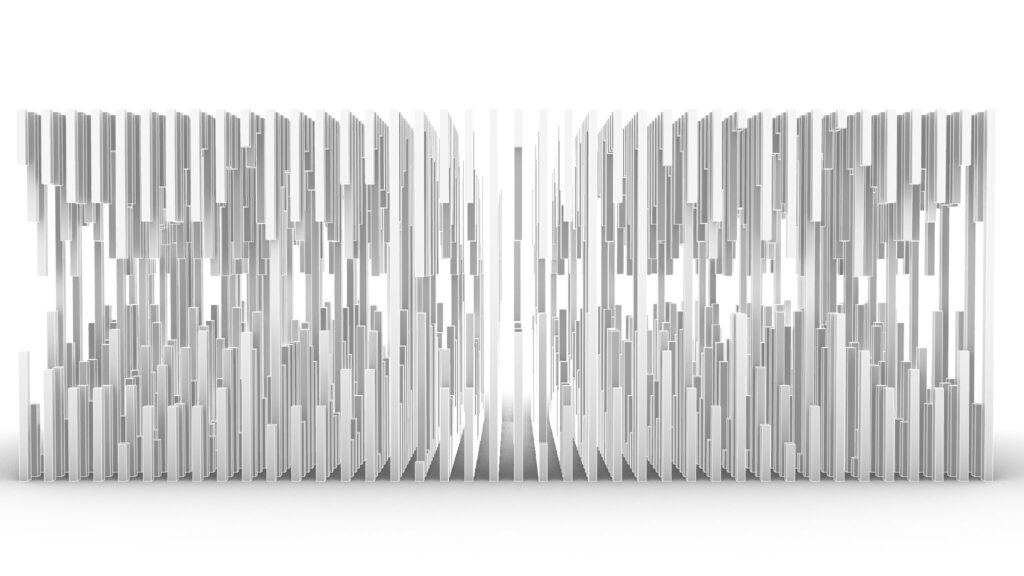

The top four images show the model exported on Rhinoceros.
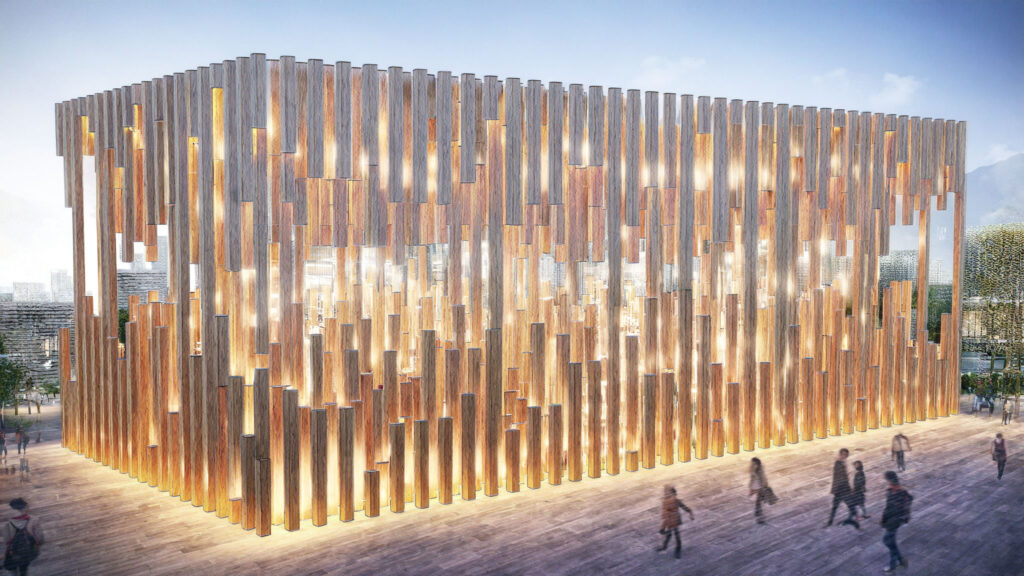
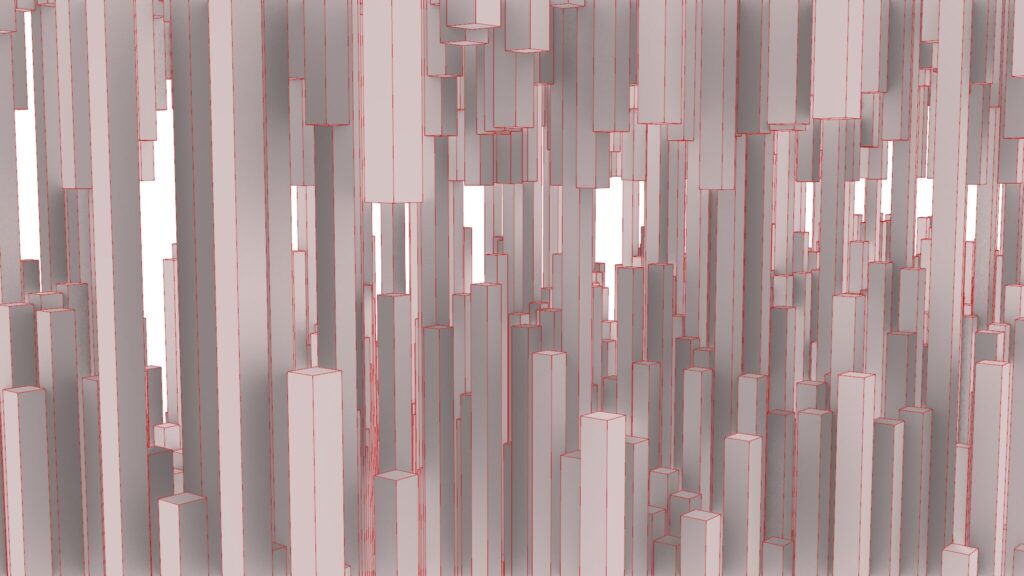
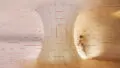
The image above shows the final rendering.
Click here to download the Grasshopper file
Please refer to the Terms of Use regarding the use of downloadable data.
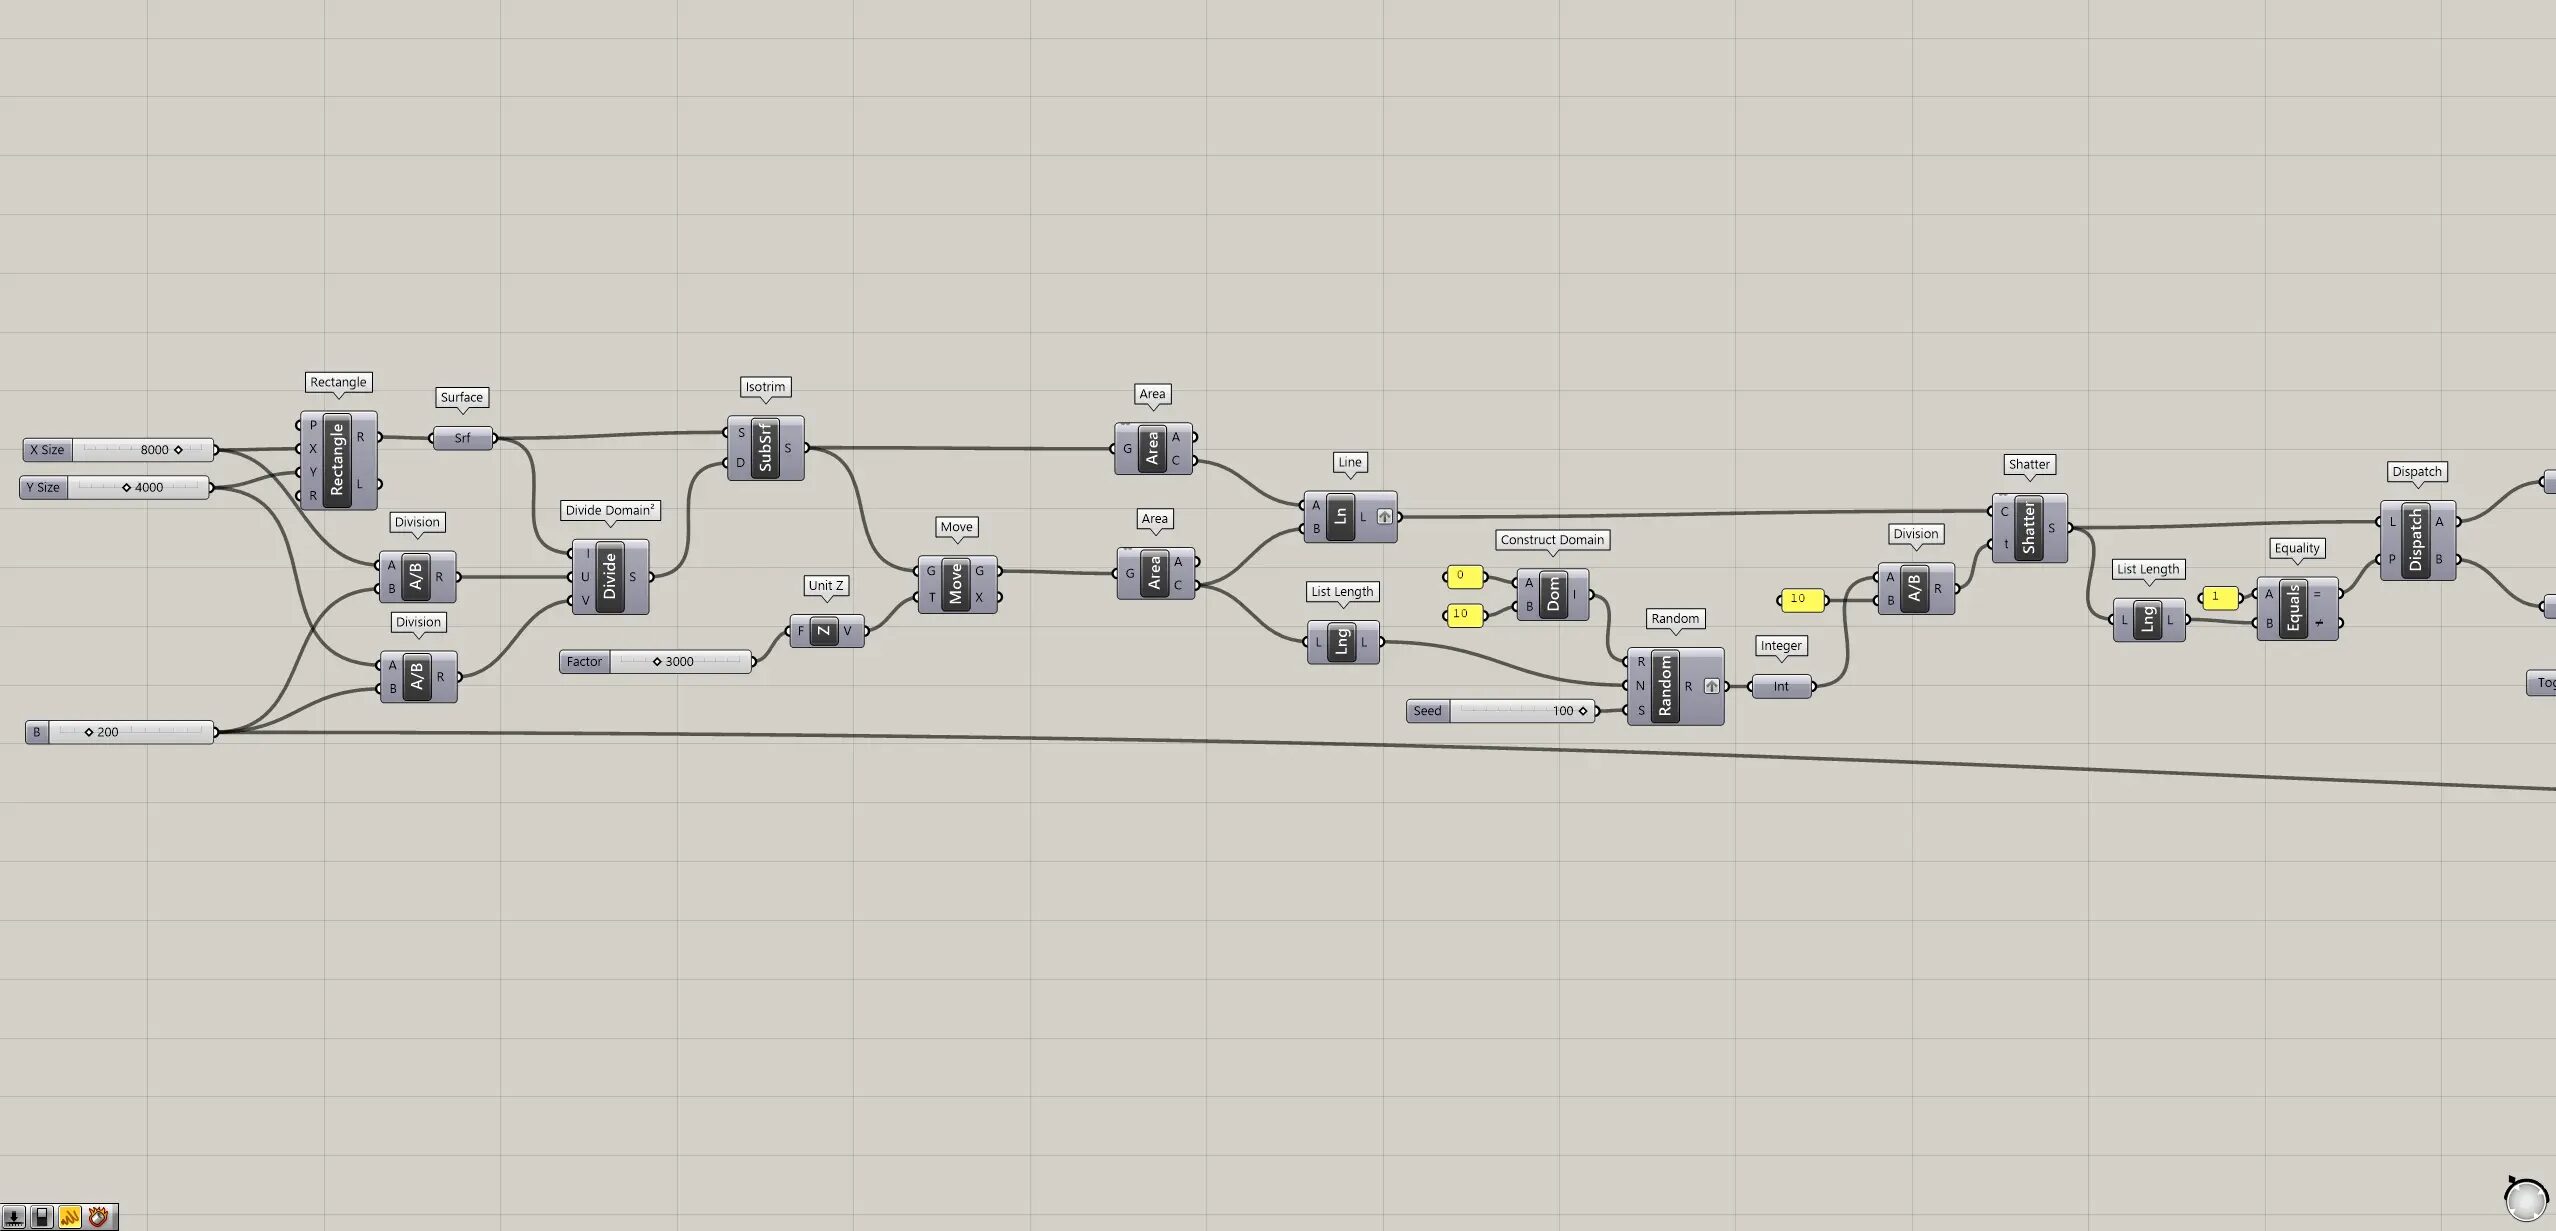
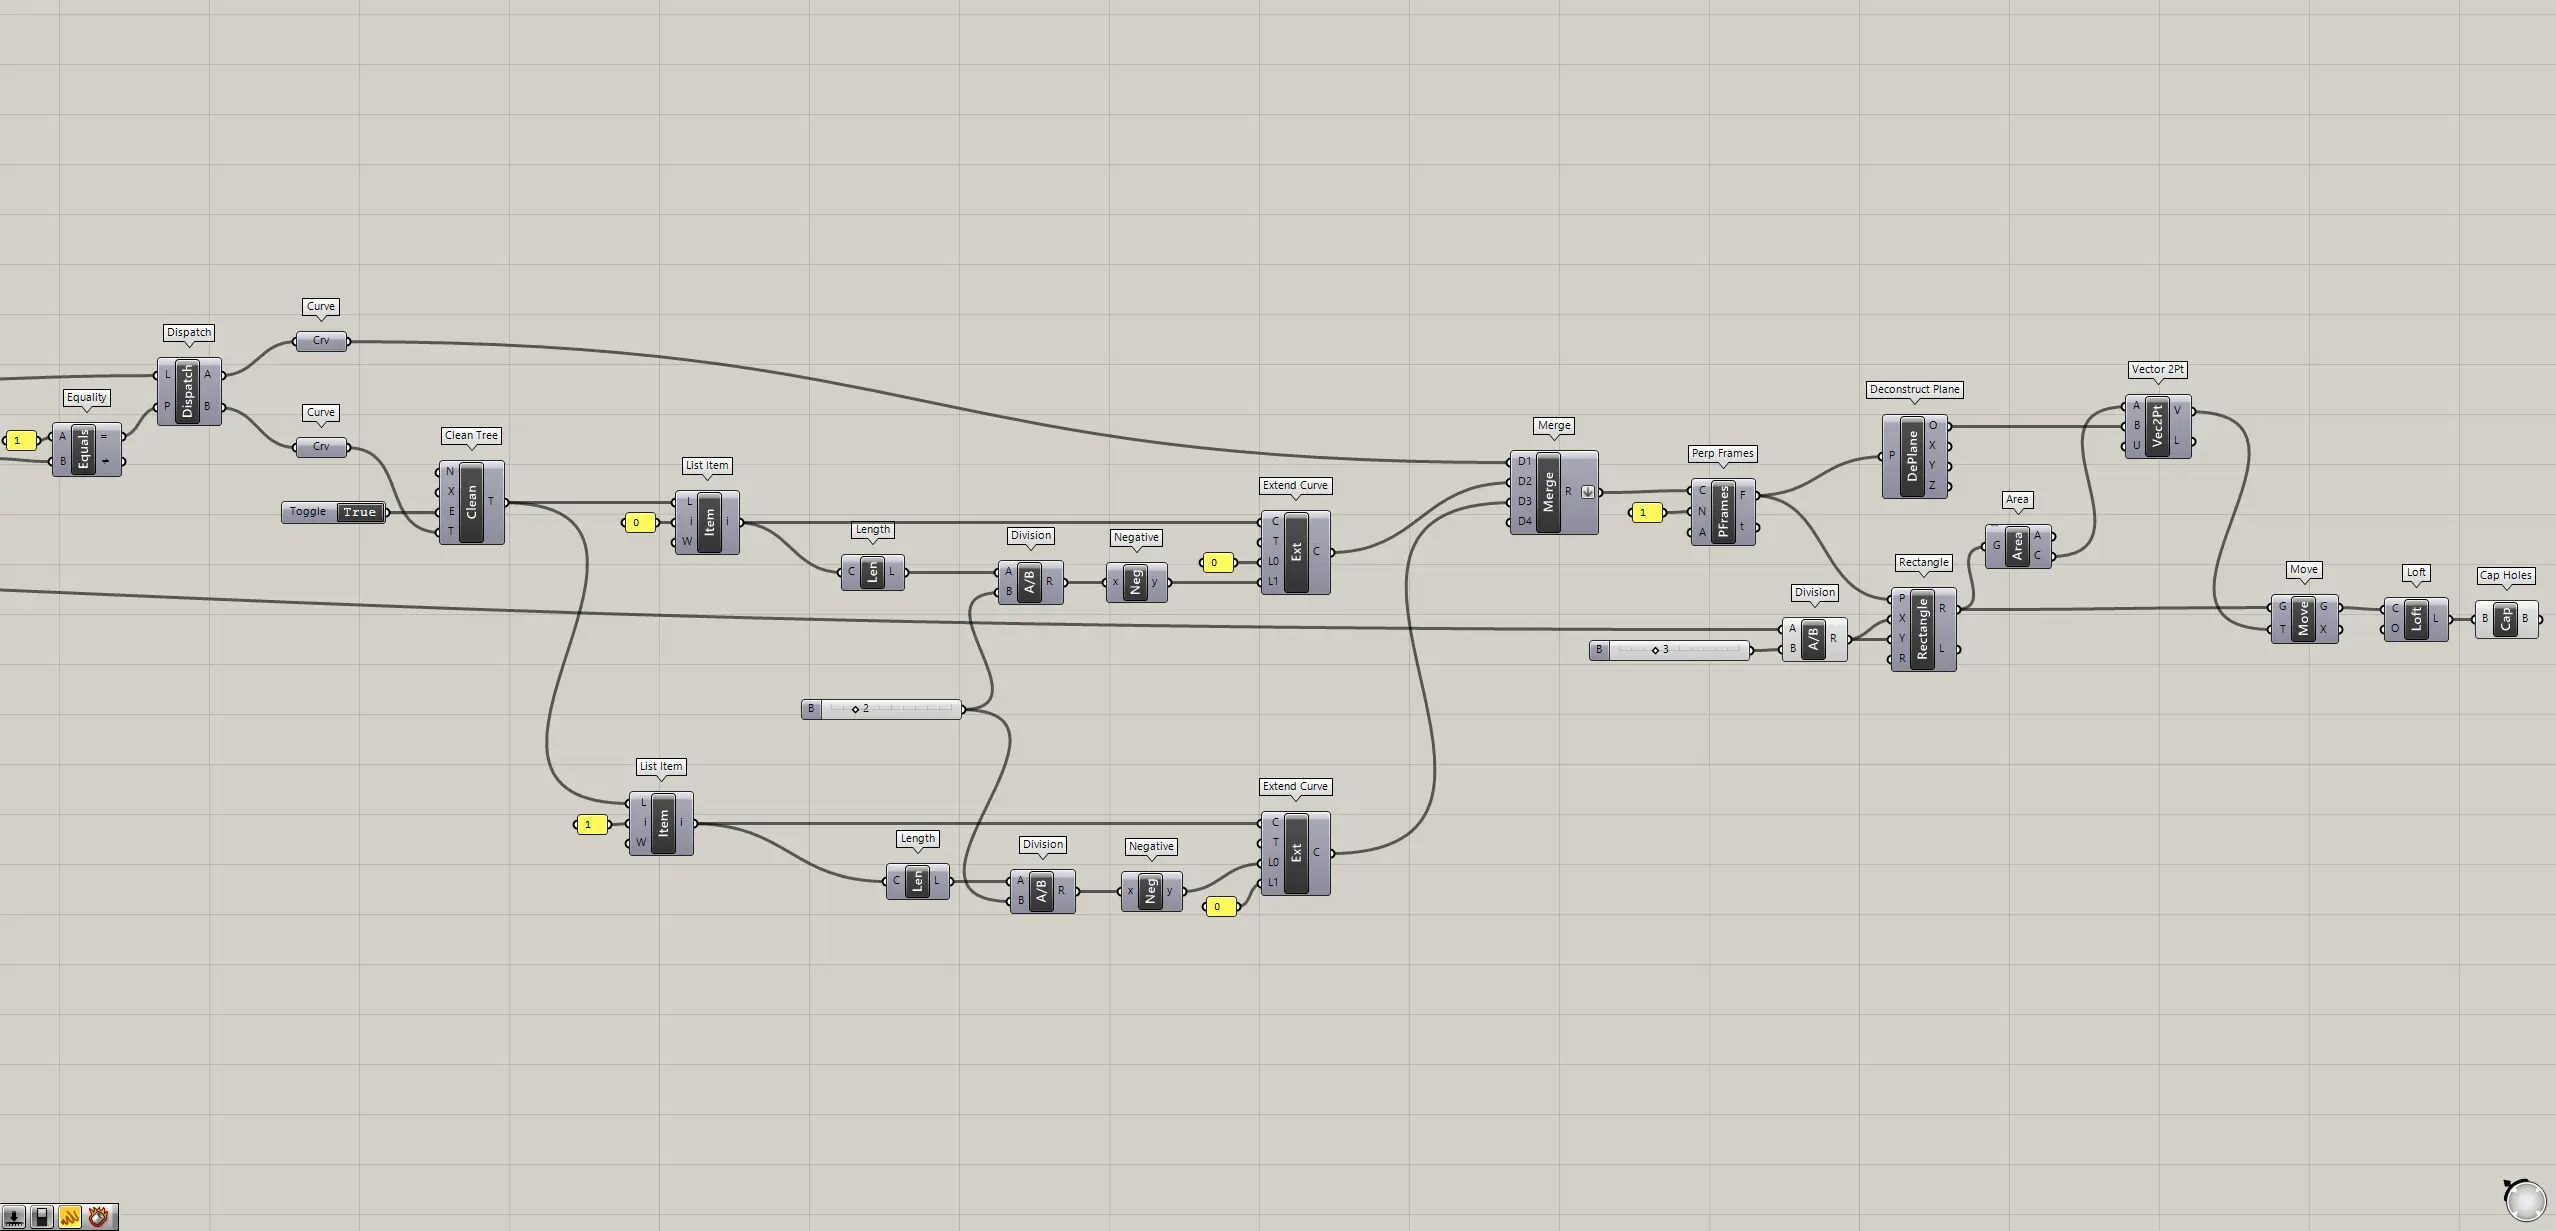
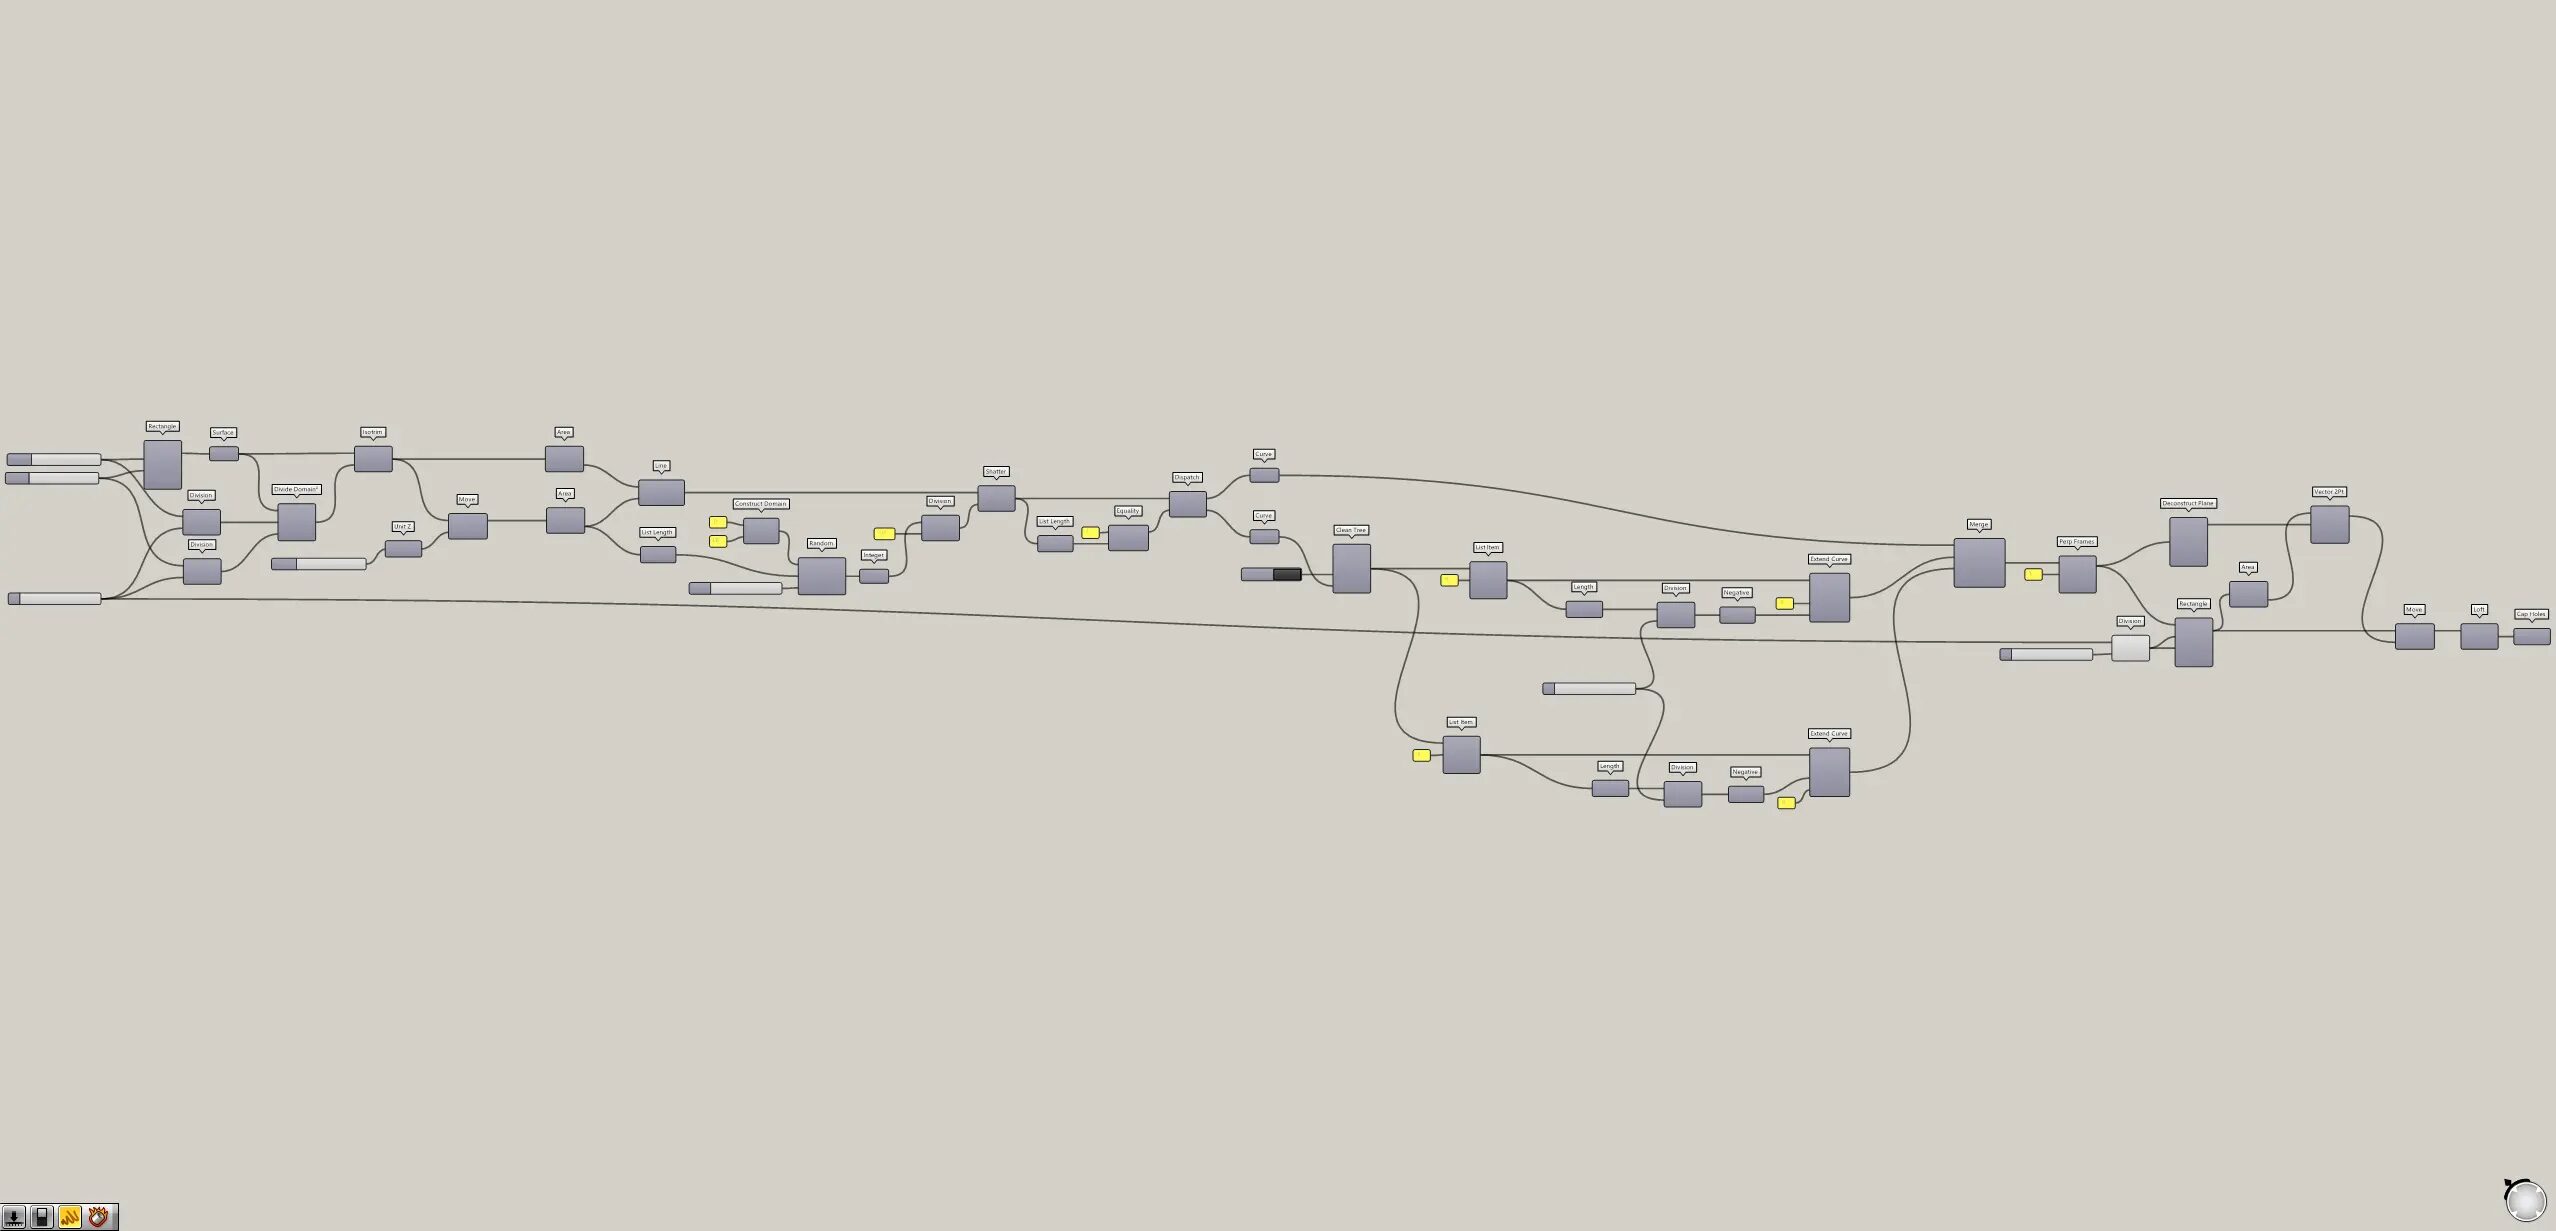
Grasshopper recipe
①Rectangle ②Surface ③Division ④Divide Domain² ⑤Isotrim ⑥Unit Z ⑦Move ⑧Area ⑨Line ⑩List Length ⑪Construct Domain ⑫Random ⑬Integer ⑭Shatter ⑮Equality ⑯Dispatch ⑰Curve ⑱Clean Tree ⑲List Item ⑳Length ㉑Negative ㉒Extend Curve ㉓Merge ㉔Perp Frames ㉕Deconstruct Plane ㉖Vector 2Pt ㉗Loft ㉘Cap Holes ㉙Boolean Toggle
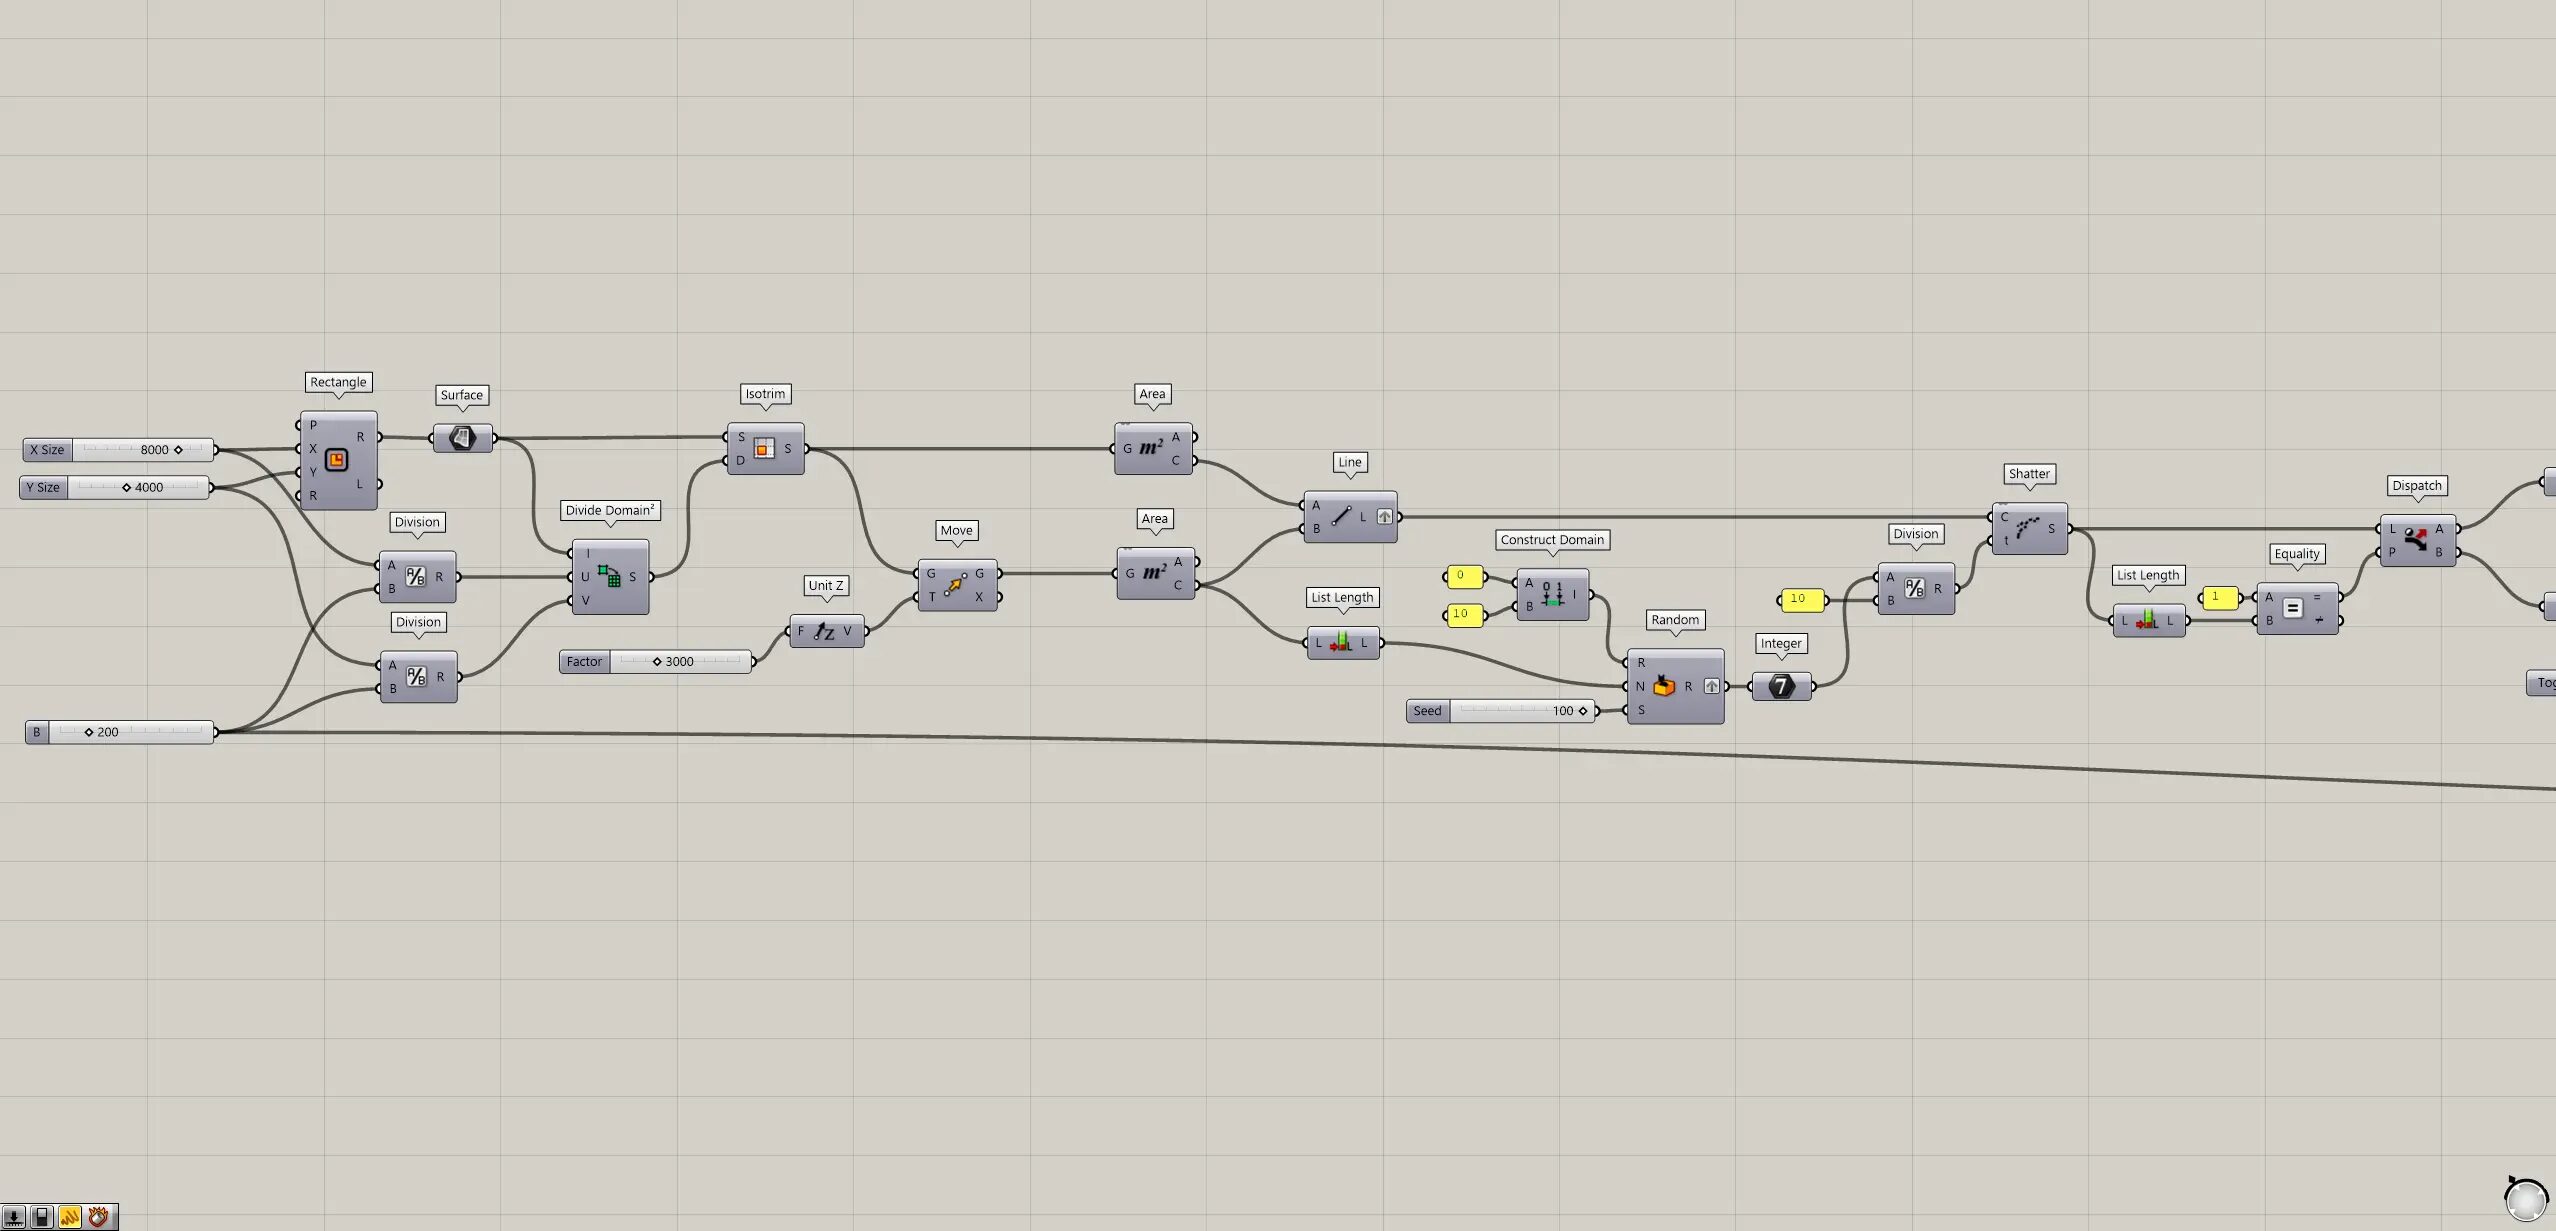
Create vertical lines
The first step is to create vertical lines.
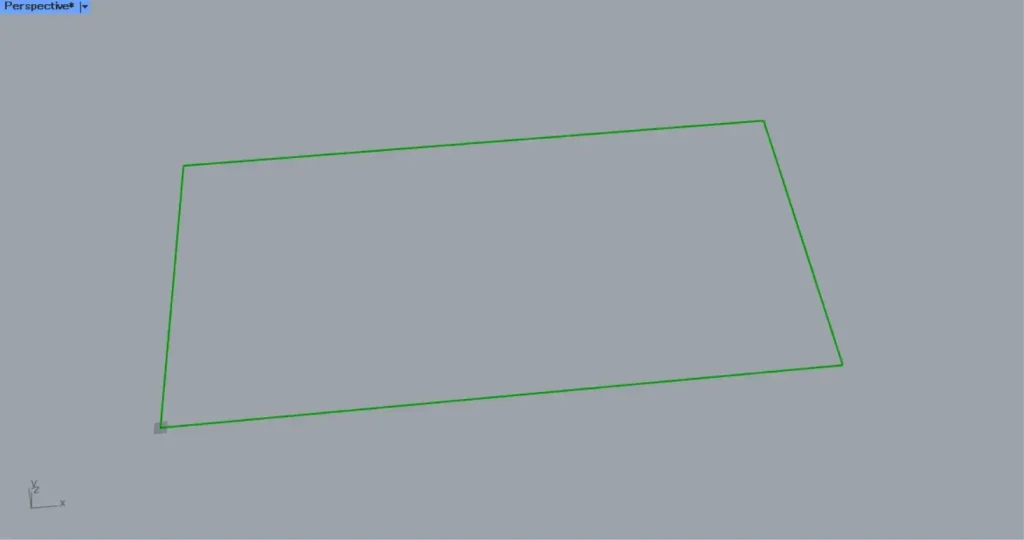
Input the numerical values of the side lengths into a Rectangle(X and Y).
In this case, 8000 is input to the X and 4000 to Y.
Then, as shown in the image above, the line data of the rectangle is created.
Then, connect the Rectangle(R) to a Surface.
As shown in the image above, a surface is now created from the line data of the rectangle.
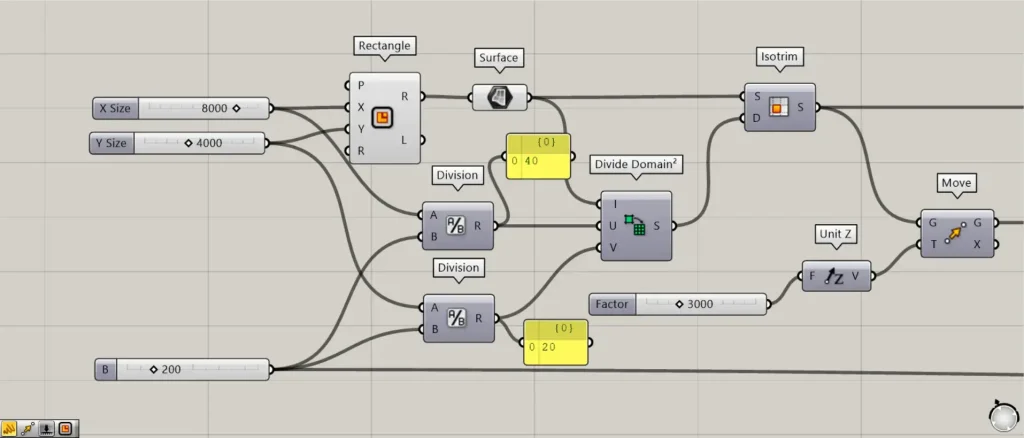
Next, we will create values to divide the surface.
Input a numerical value for the denominator of the division into two Division.
In this case, 200 is input to both.
Then connect the number 8000, the length of the side, to the first Division(A).
Then the number 8000÷200=40 is output.
In addition, connect the side length 4000 to the second Division(A).
Then the number 4000 ÷ 200 = 20 is output.
The reason for dividing the side values by the same 200 is to maintain the ratio of the side lengths.
This ensures that when the surface is divided, it will be divided by squares.
Then connect the first Division to a Divide Domain²(U).
In addition, connect the second Division to the Divide Domain²(V).
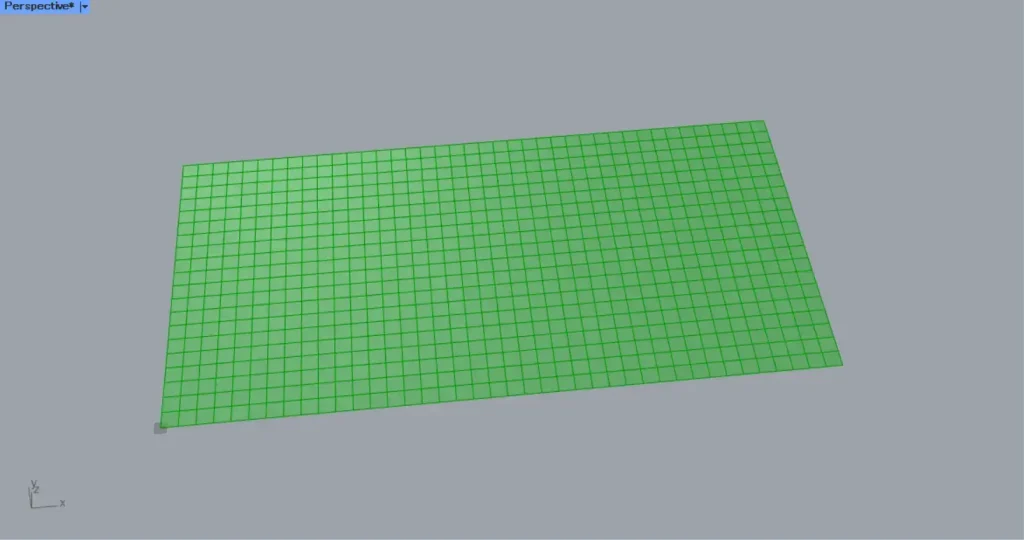
Then connect the Divide Domain² to an Isotrim(D).
In addition, connect the Surface to the Isotrim(S).
The surface is then divided into 40 x 20 sections, as shown in the image above.
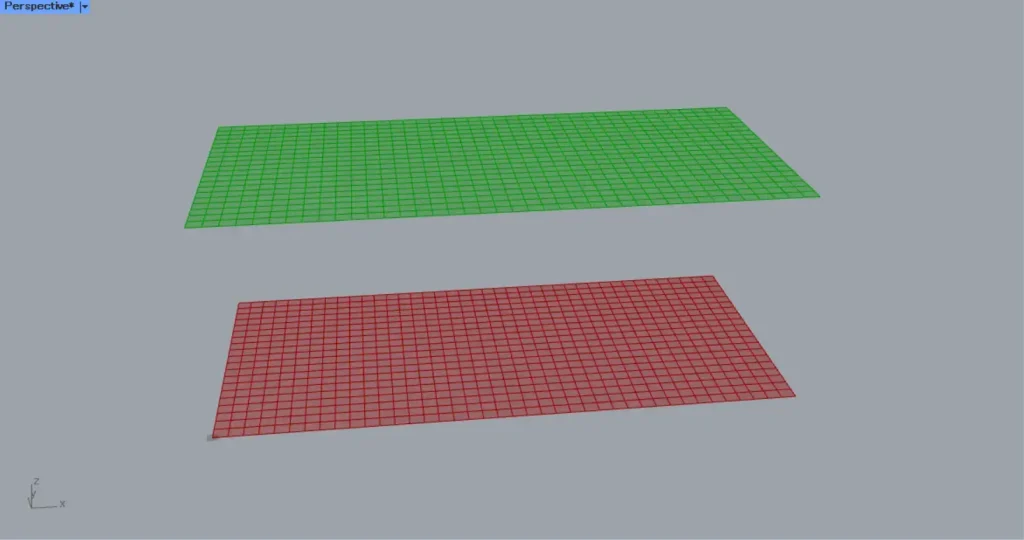
Then connect the numerical value of the distance to be moved directly above to a Unit Z.
In this case, 3000 is input.
Then connect the Unit Z to a Move(T).
In addition, connect the Isotrim to the Move(G).
Then, as shown in the image above, each surface moved directly upward.
Then place the two Area.
Connect the Isotrim and Move(G) to the Area respectively.
Then place the two Areas.
Connect the G terminals of Isotrim and Move to the Area respectively.
Then you can get the center point of each surface, as shown in the image above.
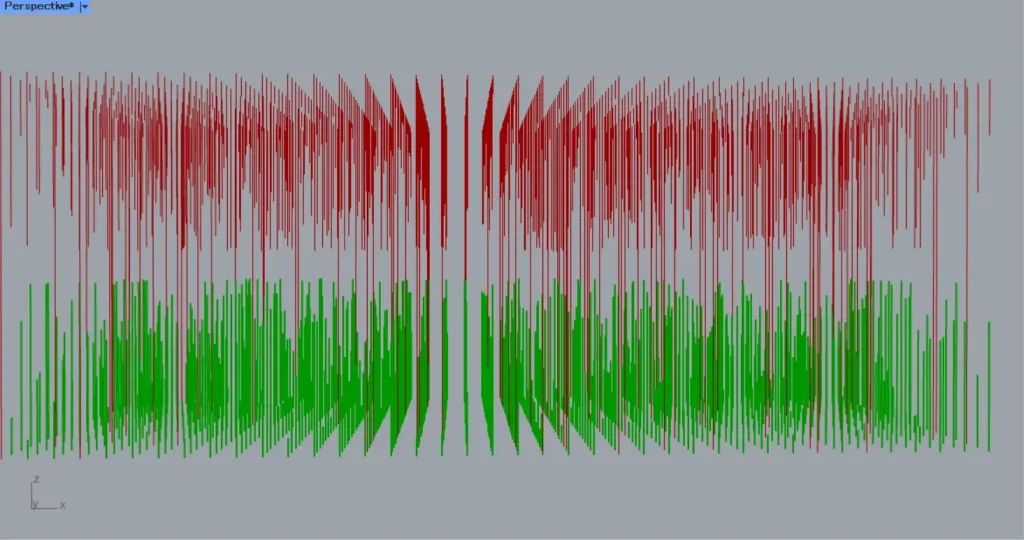
The two Area(C) are then connected to the Line.
Lines are created connecting the top and bottom center points, as shown in the image above.
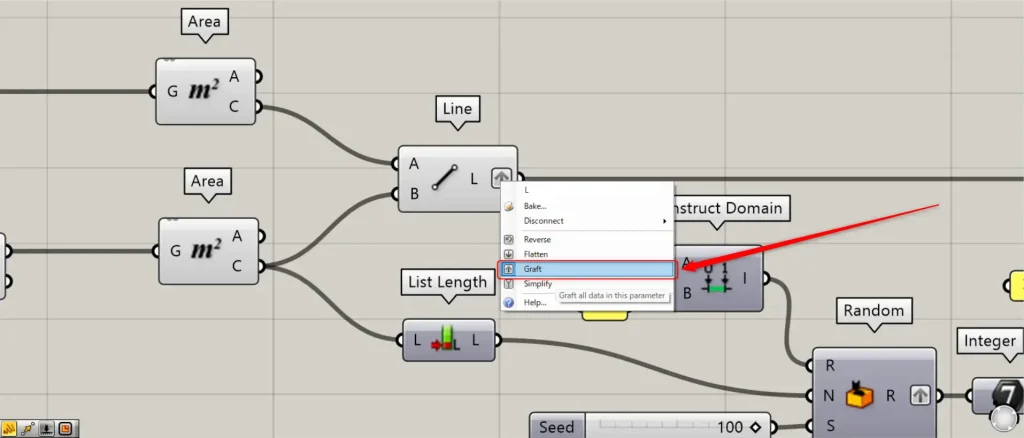
At this point, right-click on the Line(L) and set it to Graft.
Now you have created a vertical line.
Split lines at random positions
Next, split lines at random positions.
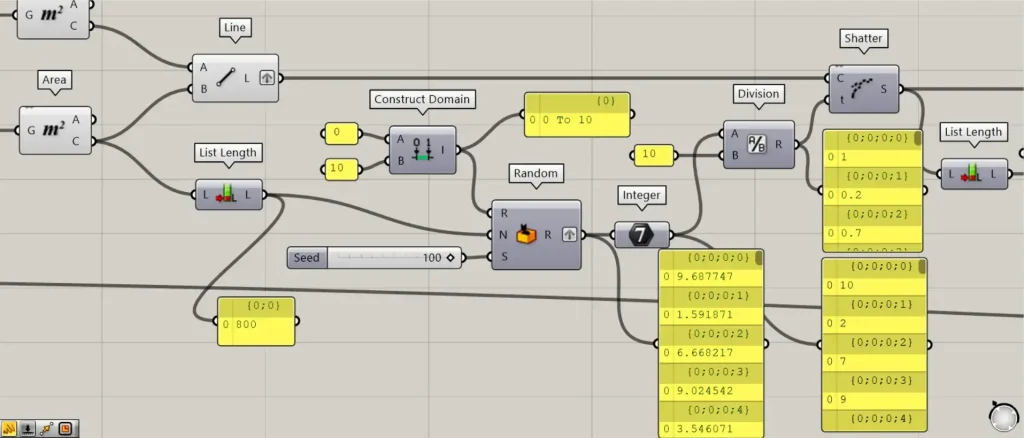
Connect the either Area(C) to a List Length.
Then you can get the numerical value of the number of lines.
In this case, 800 is obtained.
Then connect 0 to a Construct Domain(A).
In addition, connect 10 to the Construct Domain(B).
A numeric range of 0 To 10 is then created.
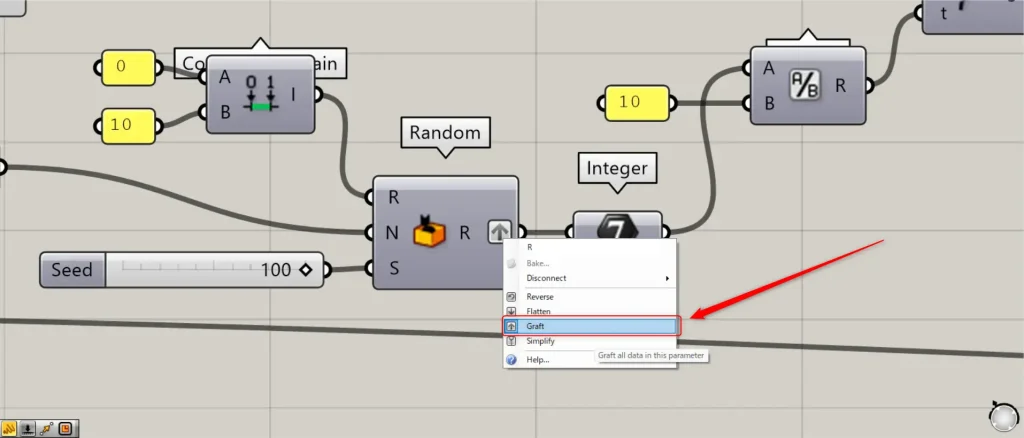
Then, connect the Construct Domain to a Random(R).
In addition, connect the List Length to the Random(N).
In addition, a seed value that changes the randomness arbitrarily is connected to the Random(S).
In this case, 100 is input.
At this time, right-click on the Random(right R) and set it to Graft.
Then 800 random numbers are created in the range of 0~10.
The Random is then connected to an Integer.
The decimal number was then converted to an integer.
Then, connect the Integer to a Division(A).
In addition, connect 10 to the Division(B).
The random number is then converted to a number from 0~1.0.
The Division is then connected to a Shatter(t)
In addition, connect the Line to the Shatter(C).
The line is then divided at the position when the line length is converted to 0~1.
For example, if the number is 0.5, the line will be split at the middle position.
If the number is 0, the line will not be split.
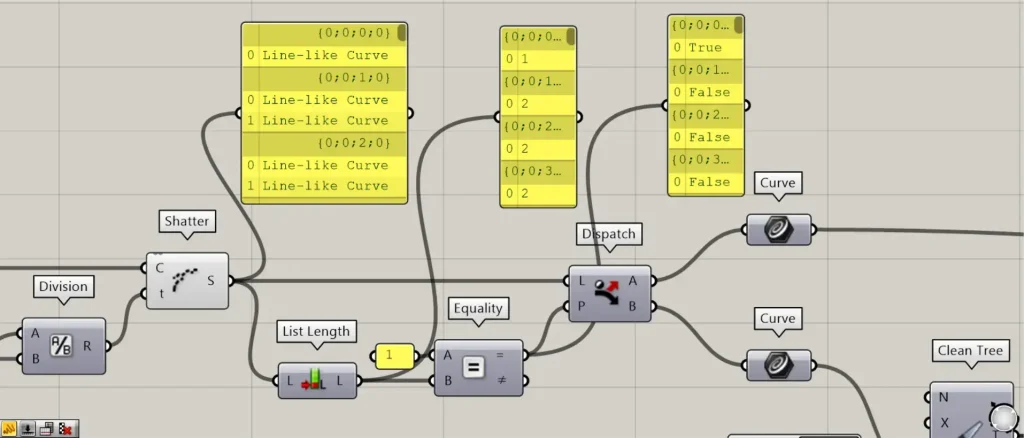
If you look at the data output from Shatter, you will see that sometimes there is one line in a branch and sometimes there are two lines.
For one line, the line is not split.
In the case of two lines, the line is split.
The case is divided into two cases, one with one line and the other with two lines.
Connect Shatter to List Length.
This will output the number of lines at each branch of data.
Then, connect List Length to an Equality(B), and connect 1 to the Equality(A).
Equality(=) outputs True for 1 and False for 2.
Then, connect the Equality(=) to a Dispatch(P).
Then, connect Shatter to the Dispatch(L).
Then, connect the Dispatch(A and B) to Curve respectively.
Then you can get the split line data from the first Curve.
From the second Curve, you can get the line data that has not been split.
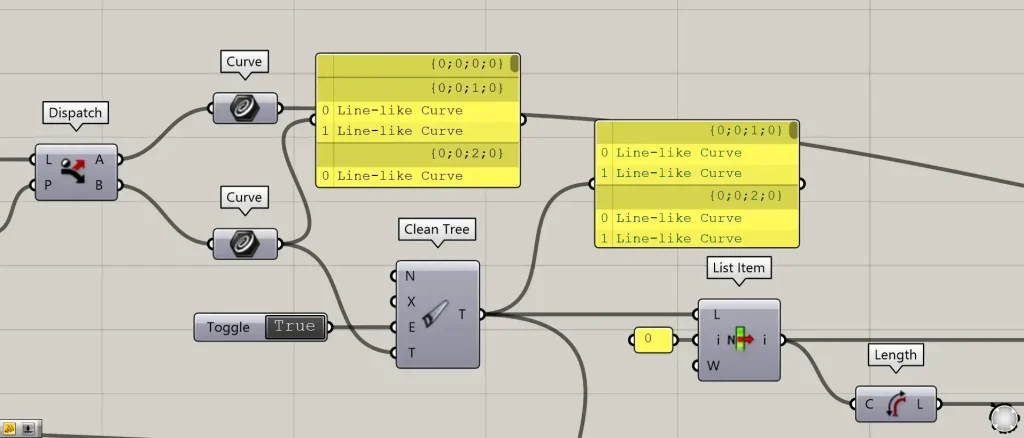
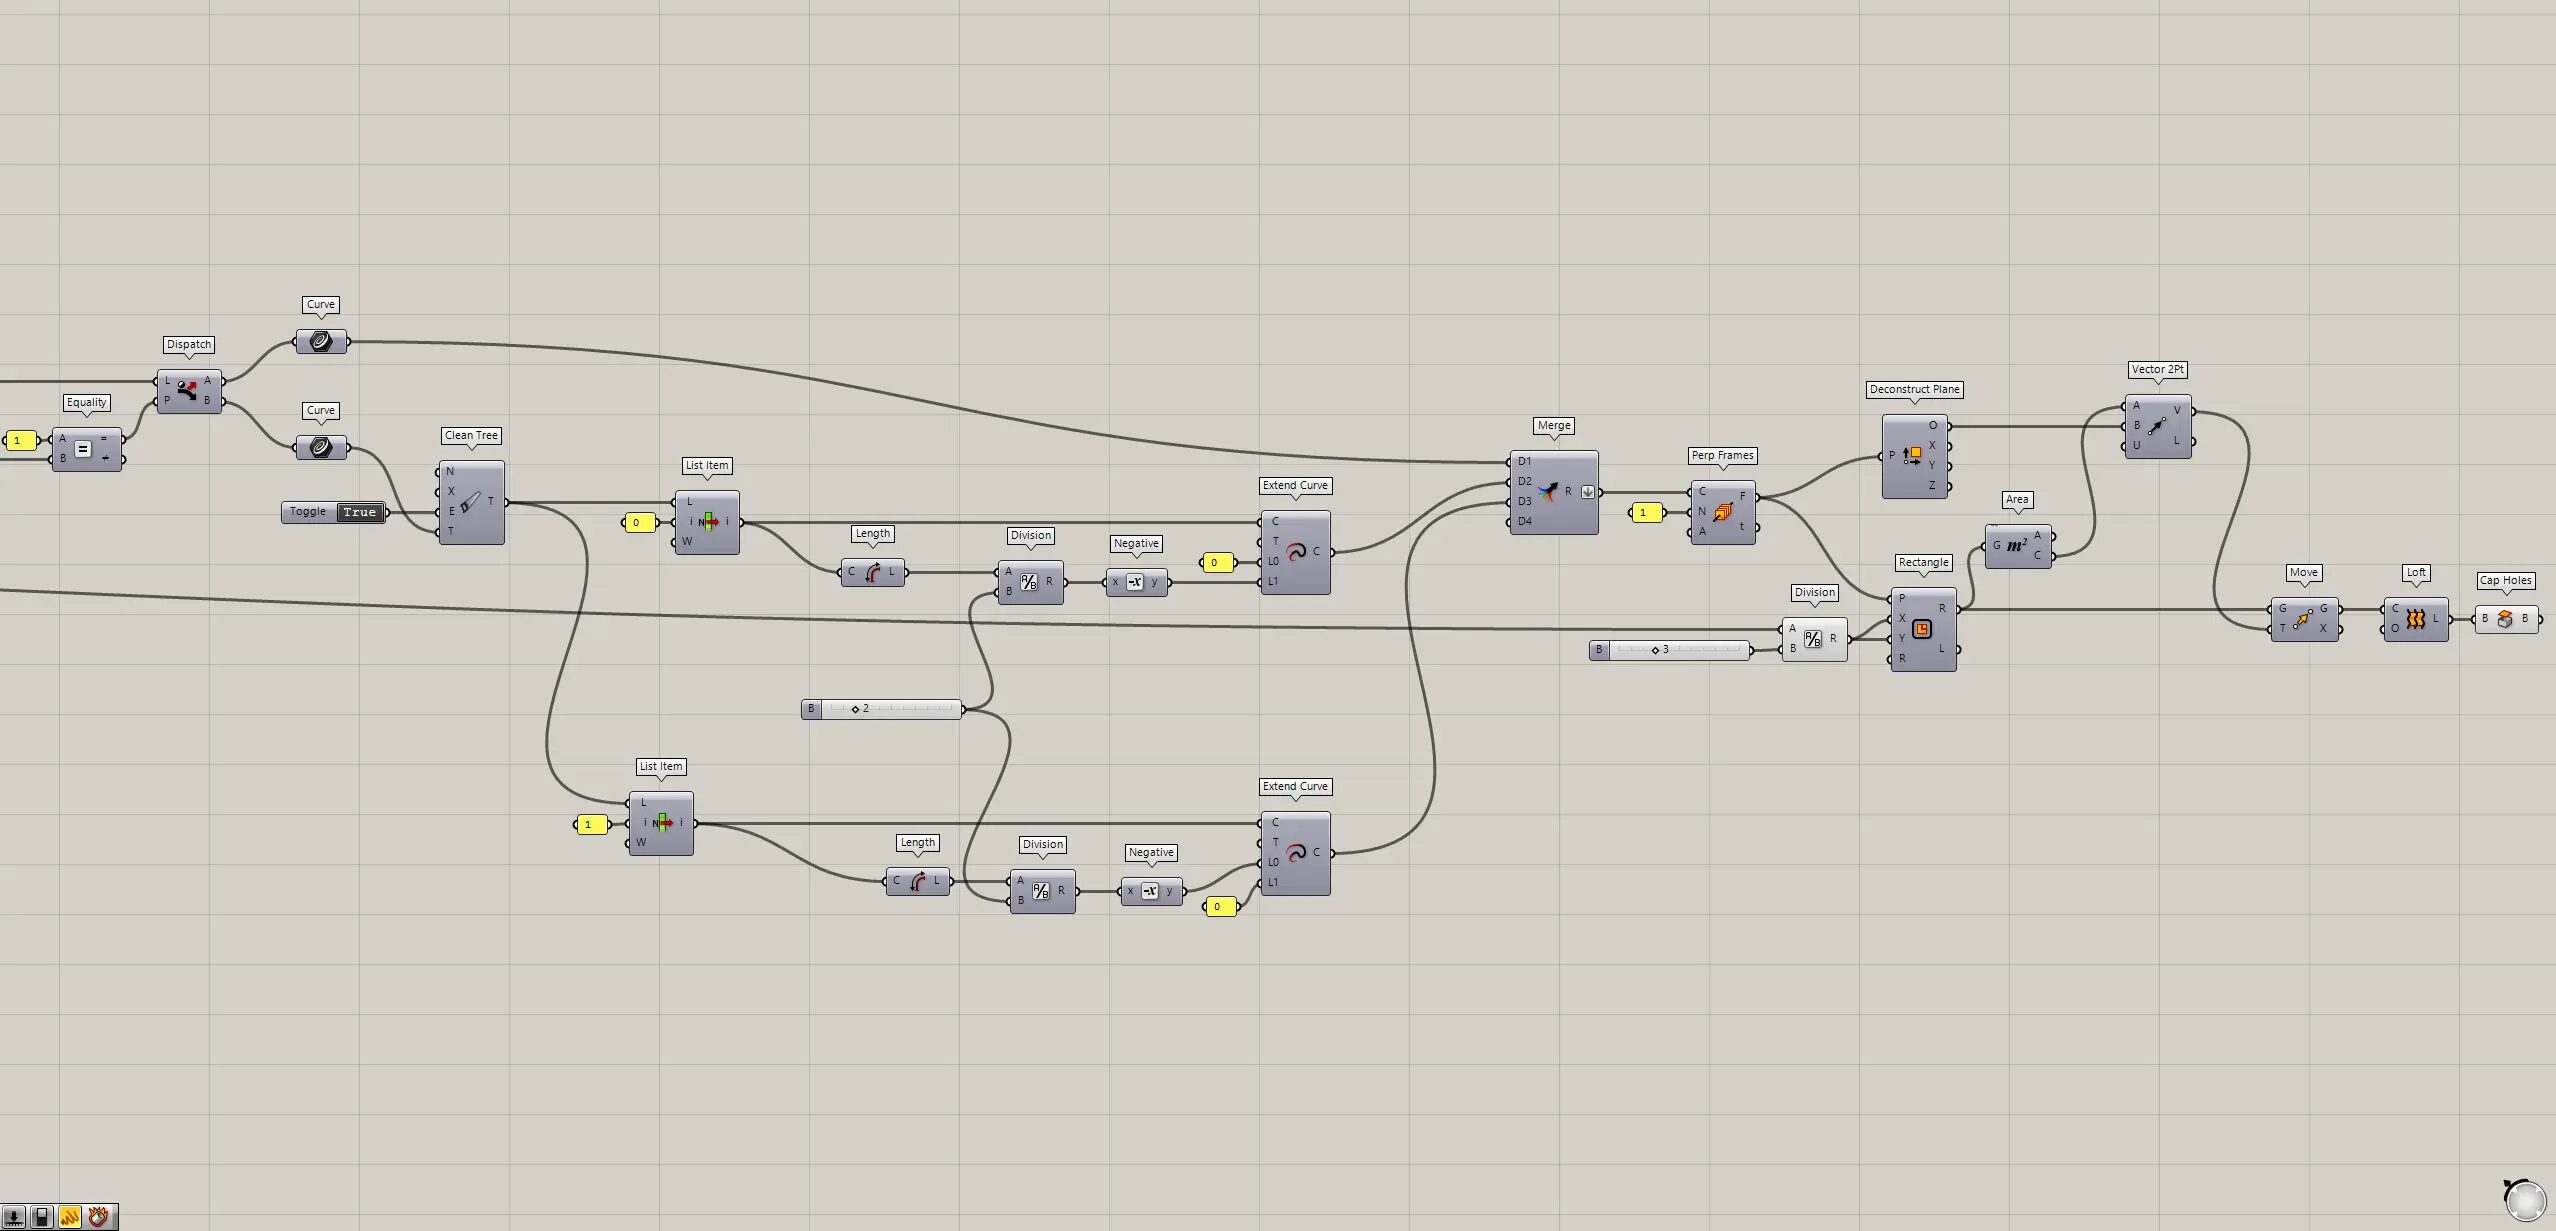
Dispatch of the B terminal of Curve will proceed.
Connect the Curve of the Dispatch(B) to a Clean Tree(T)
Further, connect the True information to the Clean Tree(E).
This time, Boolean Toggle is used to create True information.
Then the empty branch is deleted.
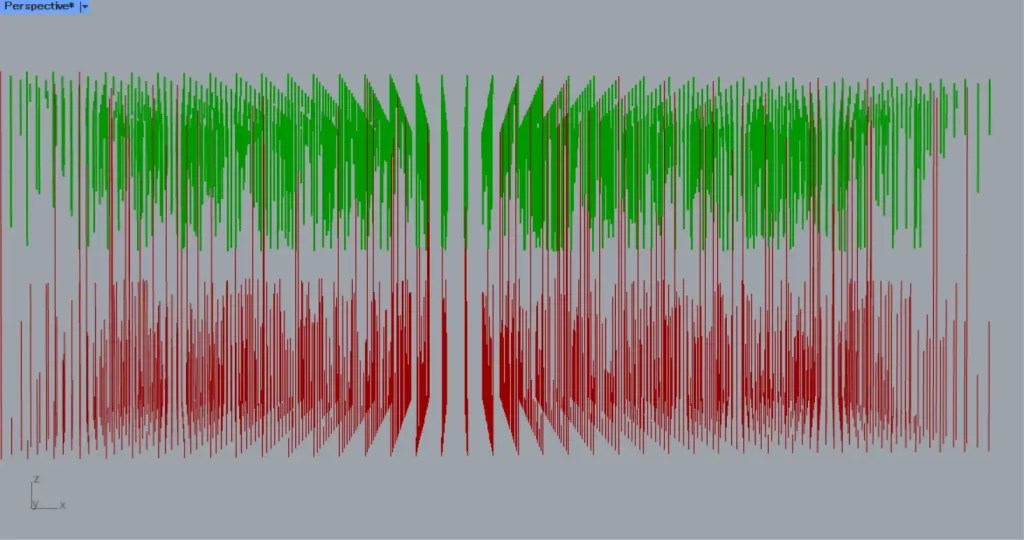
Then connect the Clean Tree to two List Item(L).
Furthermore, connect the number 0 to the first List Item(I).
Furthermore, connect the number 1 to the second List Item(I).
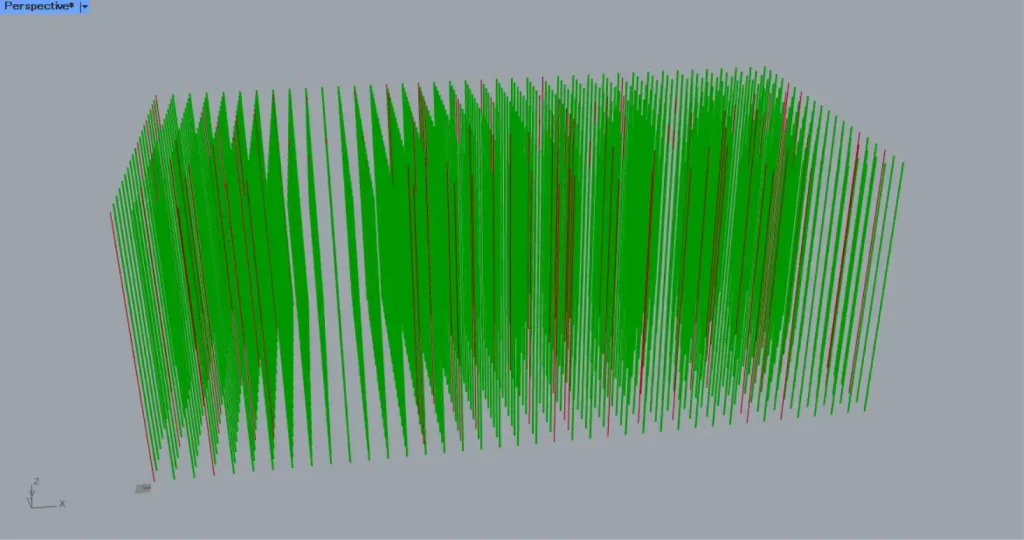
Then, as shown in the top two images, you can get the bottom lines divided for the number 0 and the top lines divided for the number 1.
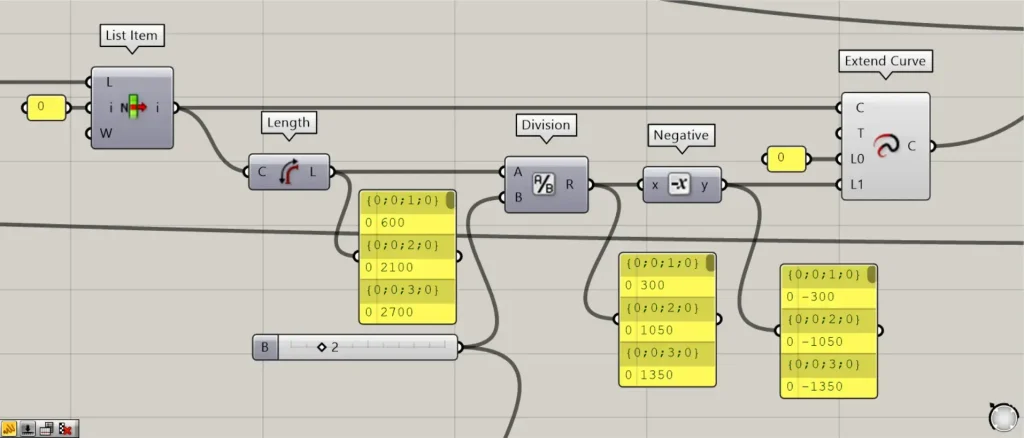
Then connect the two List Item to Length each.
Then you can get the numeric length of each line.
Then connect the two Length to Division(A) respectively.
Furthermore, connect the number 2 to the two Division.
You can then obtain the numerical value of the line length divided by 2.
Then connect the two Division to Negative respectively.
Then the number will be negative.
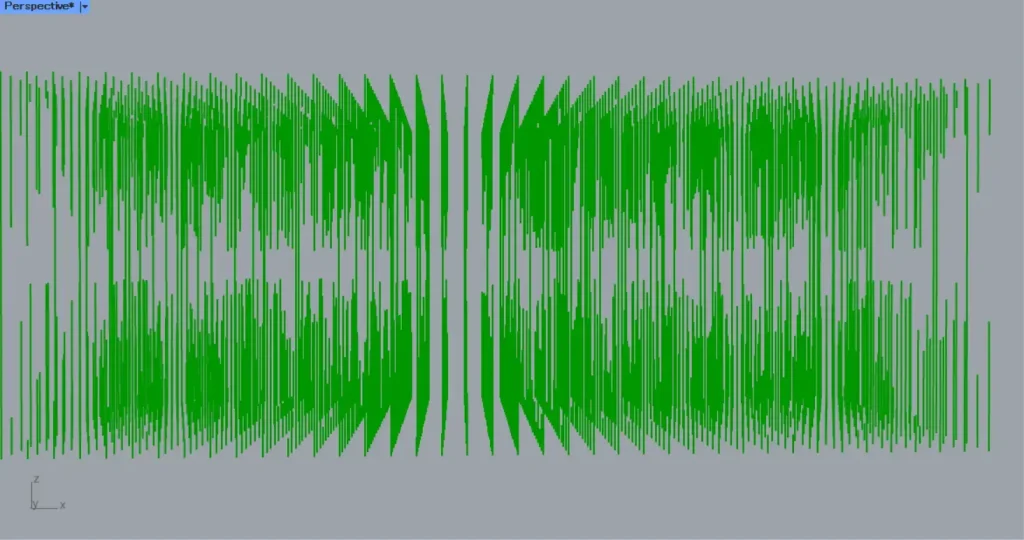
Then connect the two List Item to Extend Curve(C) respectively.
In addition, connect the number 0 to the Extend Curve(L0).
Furthermore, connect the number 0 to the second Extend Curve(L1).
In addition, connect the first Negative to the first Extend Curve(L1).
In addition, connect Negative to the L0 second Extend Curve(L0).
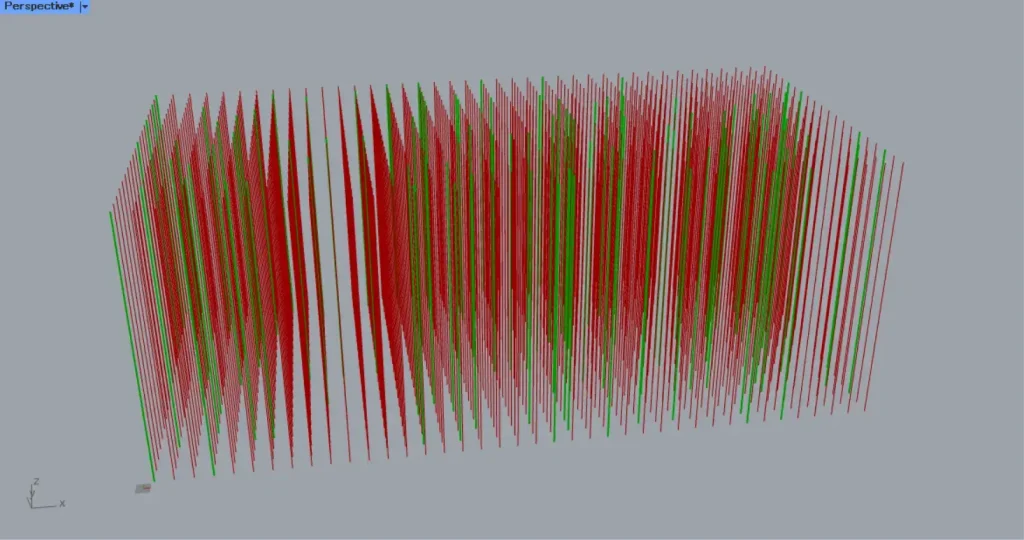
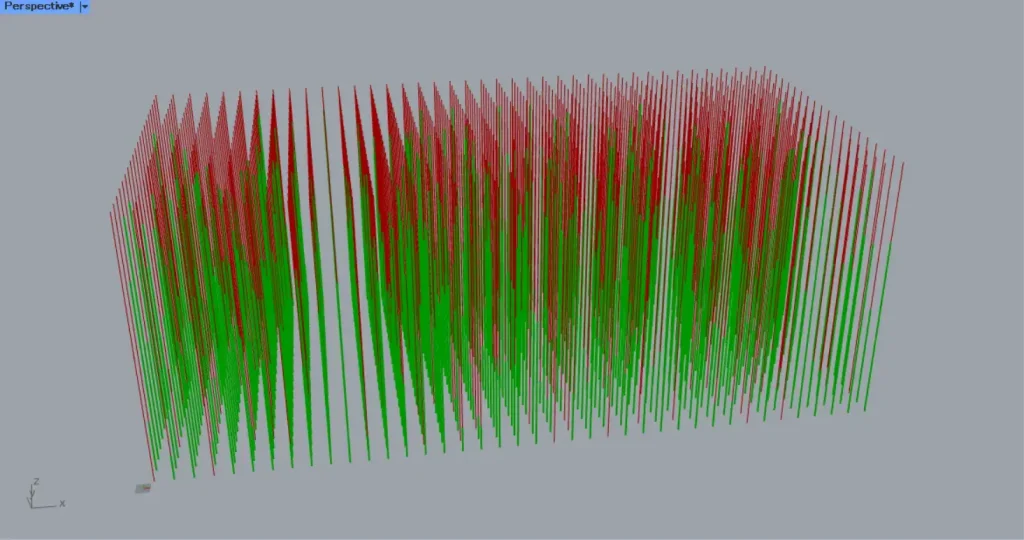
Then, as shown in the image above, the length of the lines was shortened and a hollow was created in the center.
Then, the Curve of the Dispatch(A) and the two Extend Curves are connected to a Merge.
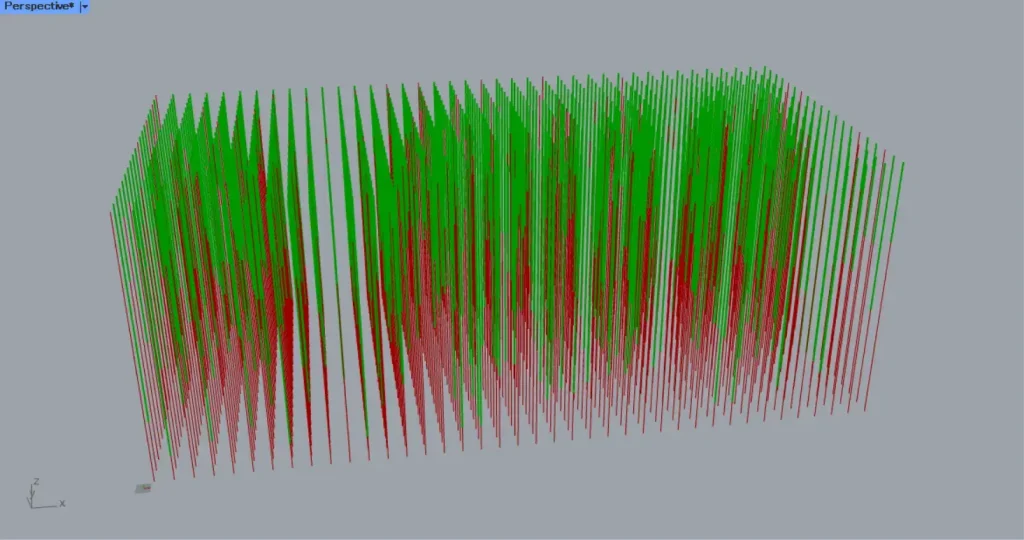
Then we were able to combine the undivided and divided line data, as shown in the image above.
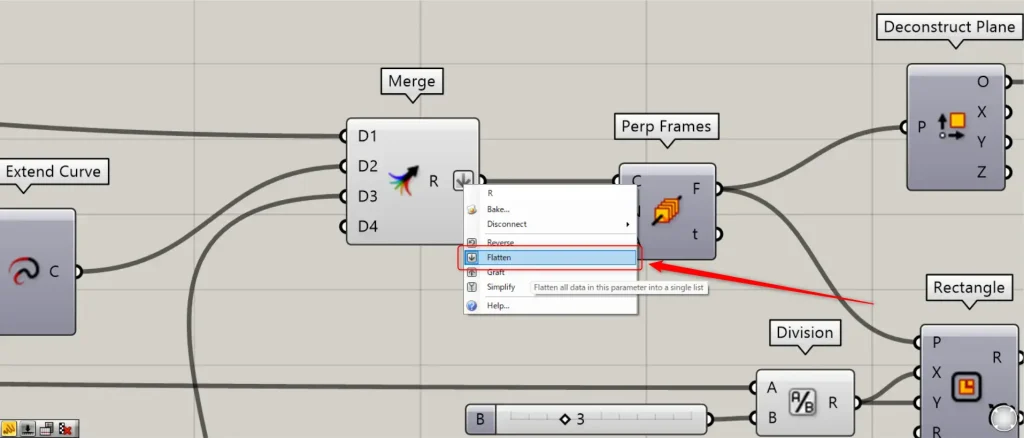
At this point, right-click on the Merge(R) and set Flatten.
Now we can split the lines at random positions.
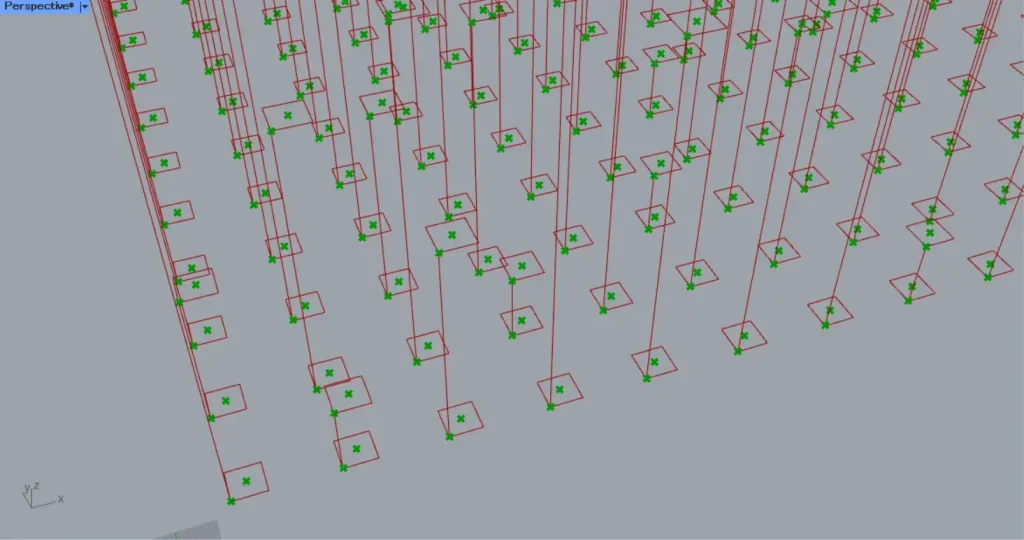
Create boxes from lines
Next, Create boxes from lines.
Connect Merge to a Perp Frames(C).
Furthermore, connect 1 to the Perp Frames(N).
Then planes are created at each end of each line.
Then connect the 200 number used at the beginning to a Division(A).
Furthermore, connect 3 to the Division(B).
Then the number 200 divided by 3 is output.
This number is for the length and width of the rectangle.
Then connect Perp Frames(F) to a Rectangle(P).
In addition, Division is connected to the Rectangle(X and Y).
Then square lines are created at both ends of the line, as shown in the image above.
Then connect the Perp Frames(F) to a Deconstruct Plane.
Then you can get the point data of the origin of the planes.
Furthermore, connect the Rectangle(R) to an Area.
Then you can get the point data of the center points of the squares.
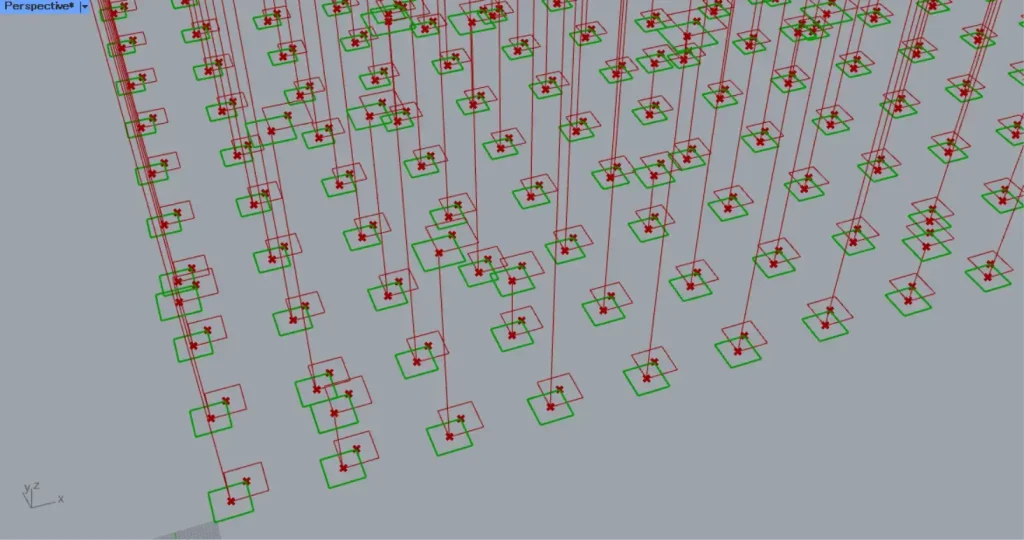
Then connect the Area(C) to a Vector 2Pt(A).
In addition, connect the Deconstruct Plane(O) to the Vector 2Pt(B).
Then you can get the vector data from the center points of the squares to the origin of the planes.
Then connect the Vector 2Pt(V) to a Move(T).
Furthermore, connect the Rectangle(R) to the Move(G).
Then the square lines have been moved to a position centered on the origin of the planes, as shown in the image above.
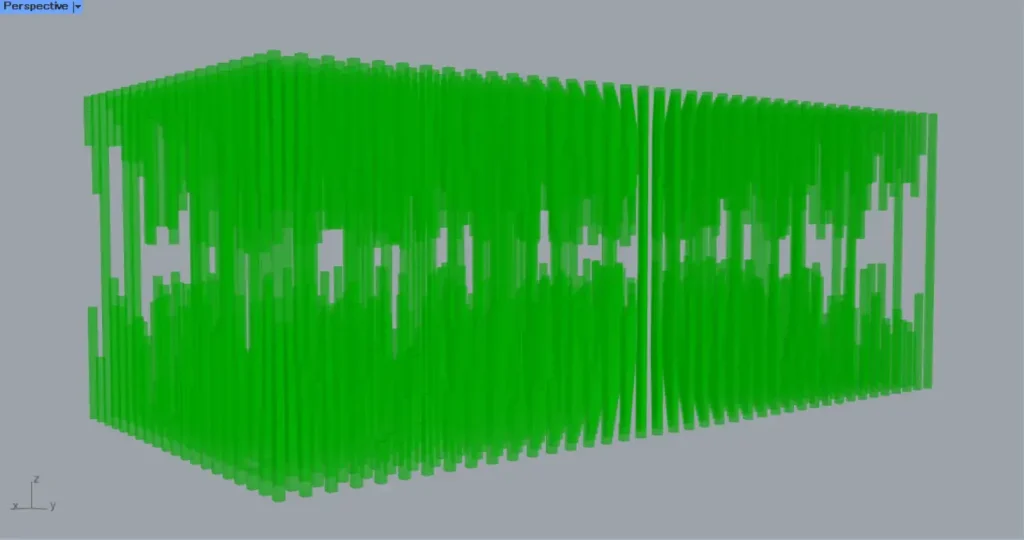
Then connect the Move(G) to a Loft.
Then boxes are created by connecting the rectangle lines, as shown in the image above.
Then connect the Loft to a Cap Holes.
This plugs the hole in the box.
This completes the process.
That is all for this time.


Comment