In this article, we will explain how to create louvers that radiate in a parabolic fashion in Grasshopper.
The Grasshopper file used in this project is also available for download.
Video
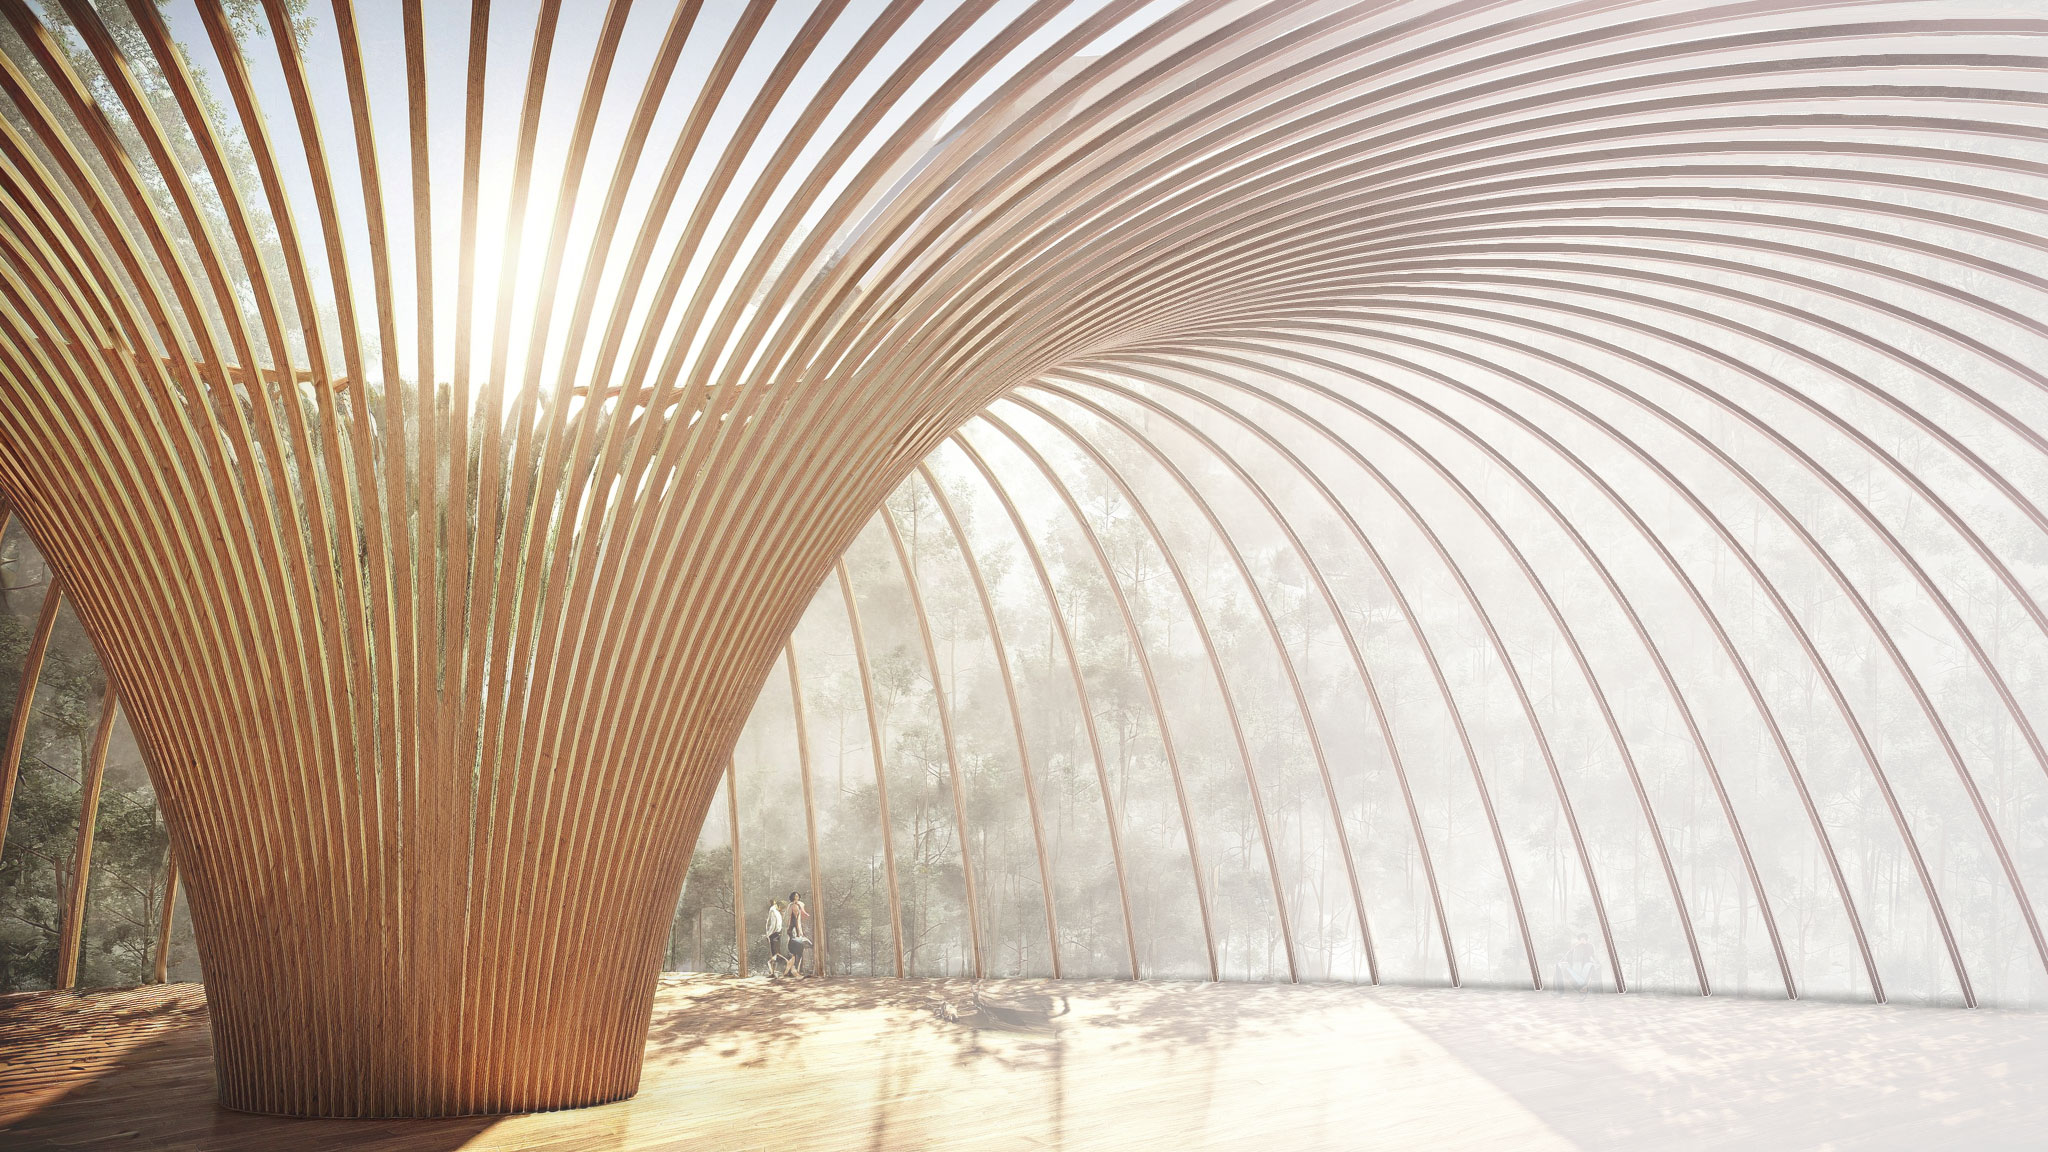
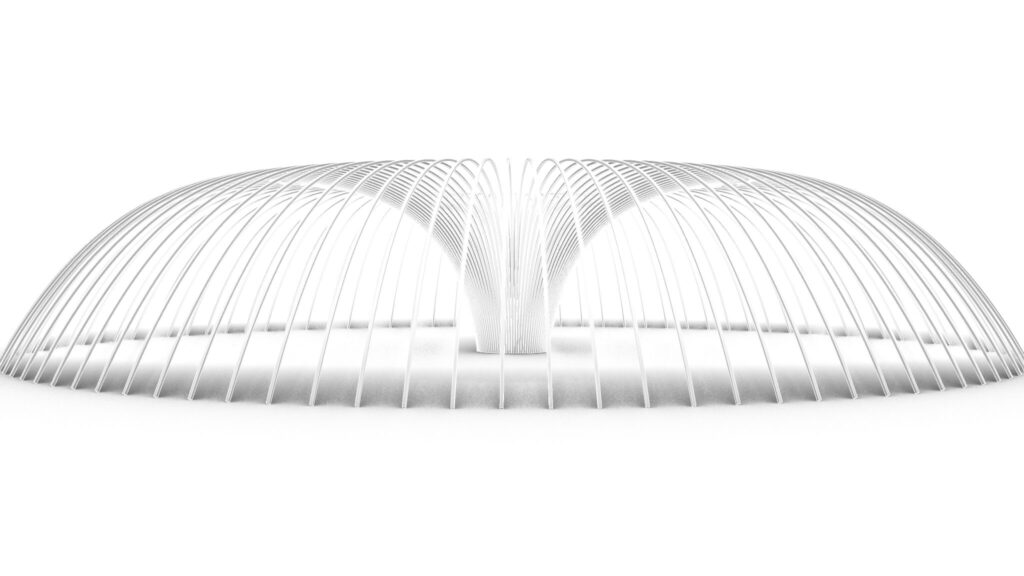
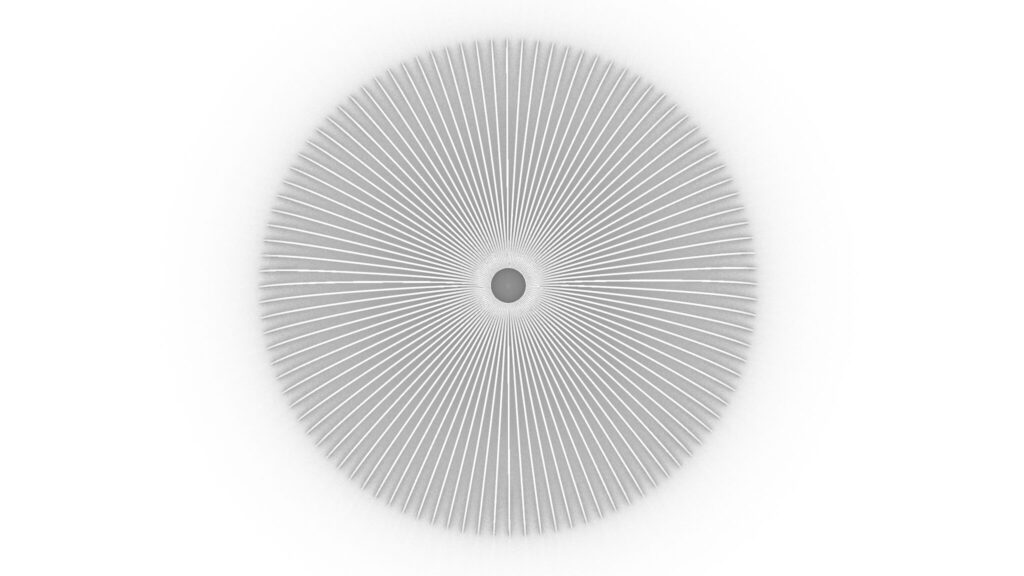
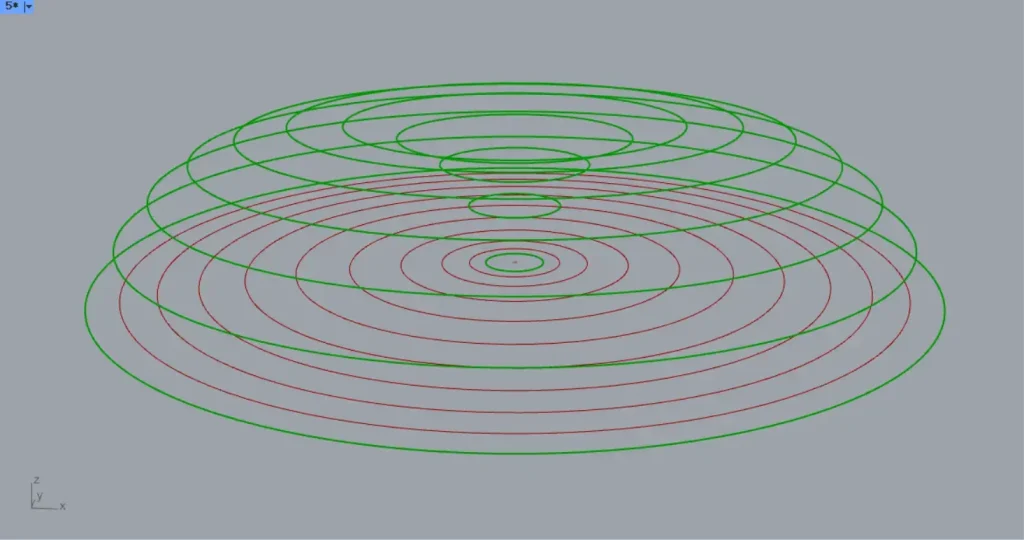
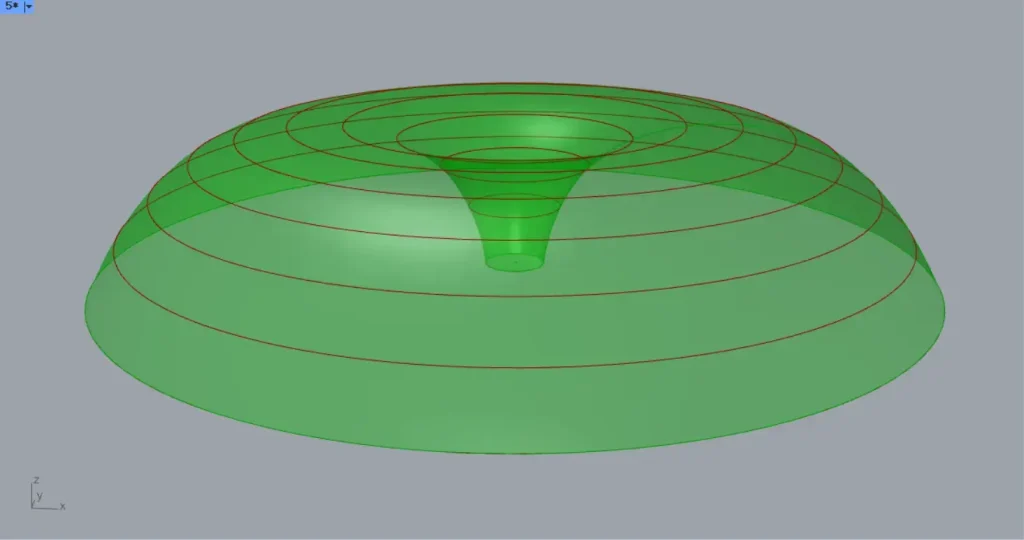
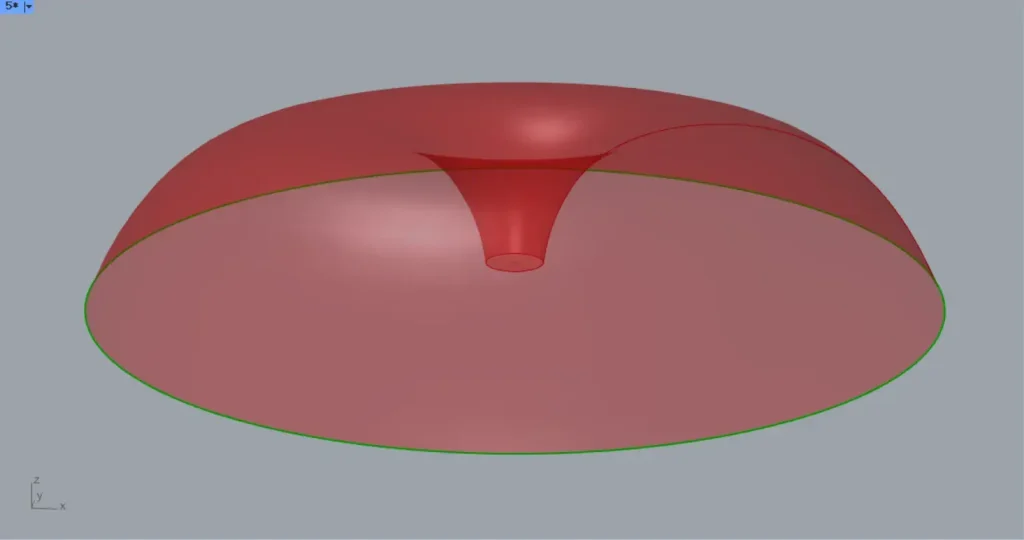
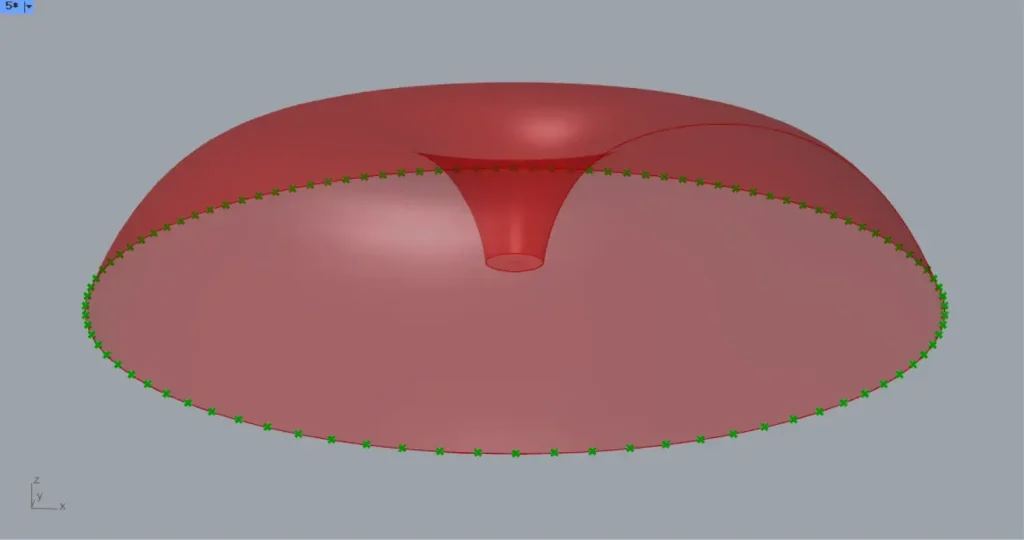
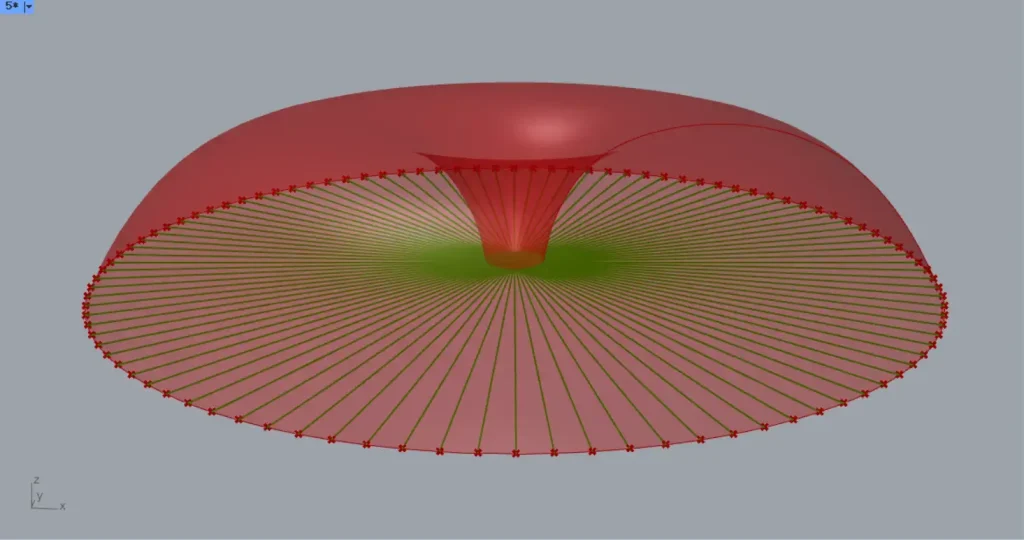
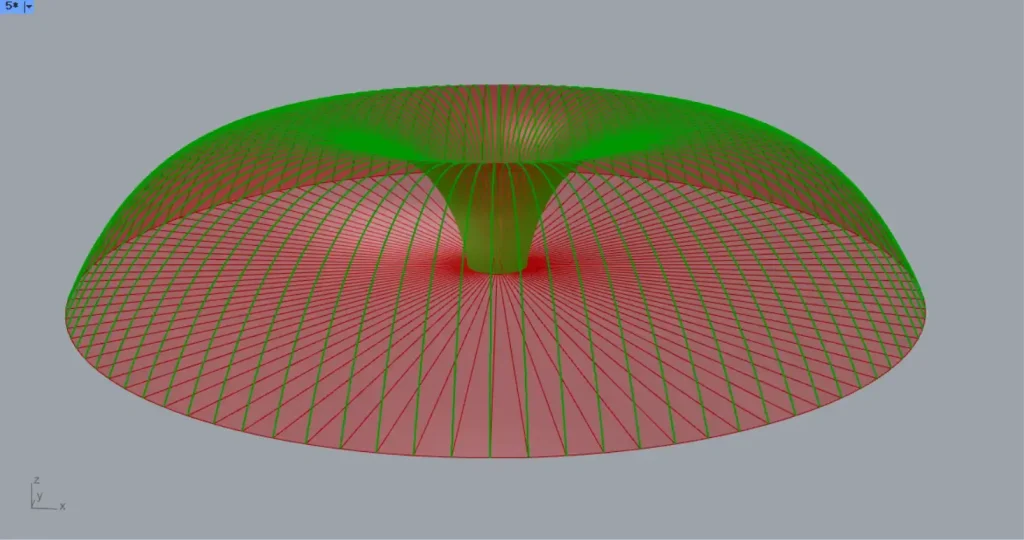
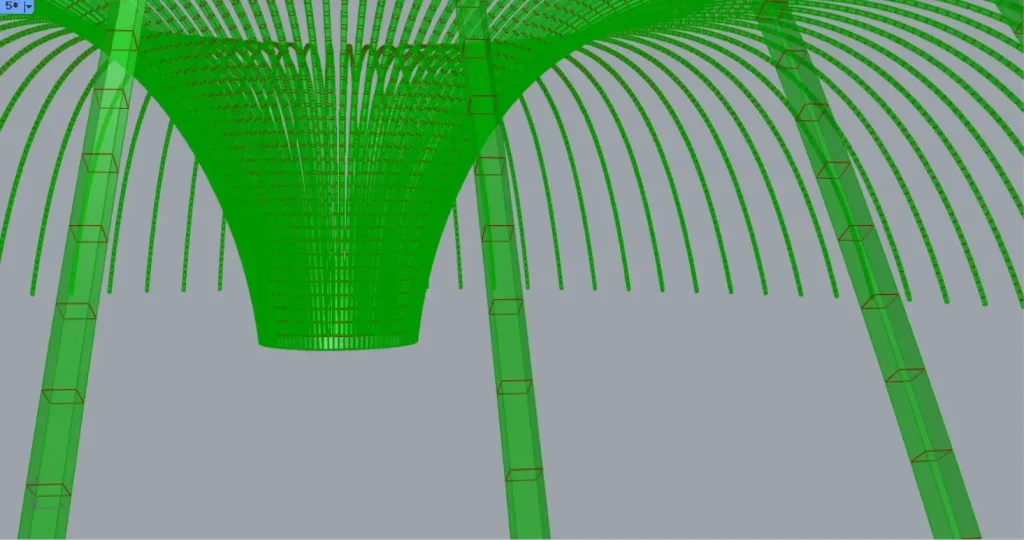
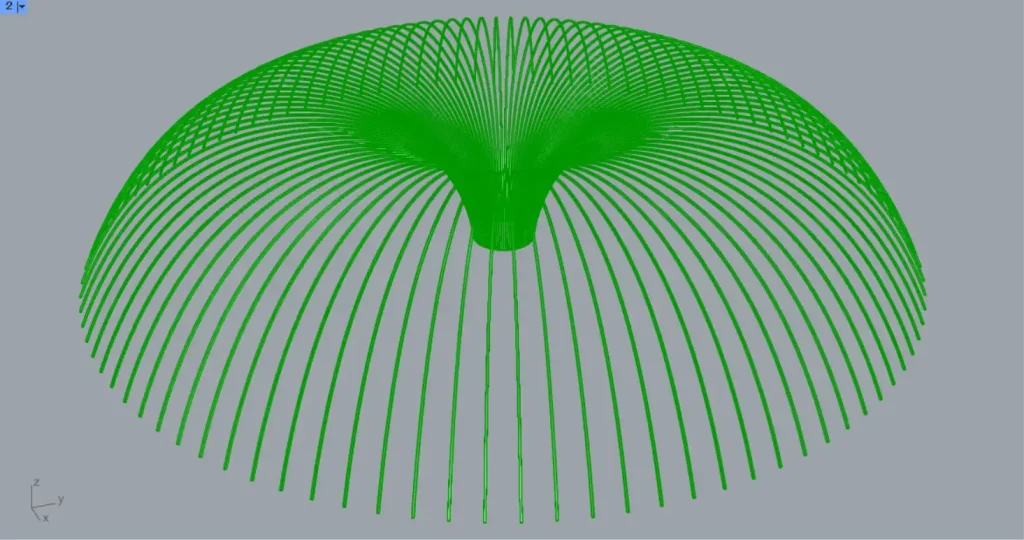
Model Images


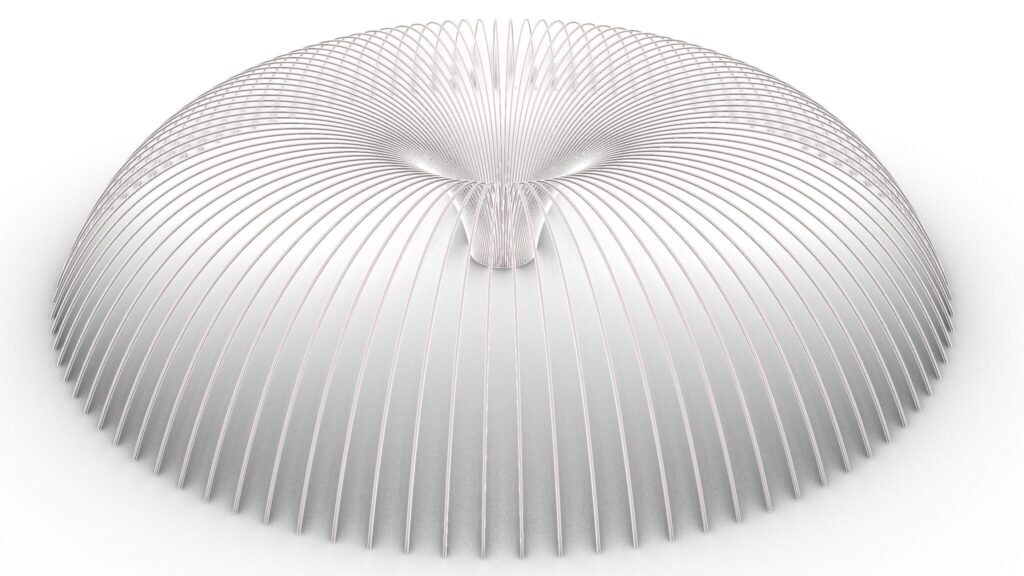
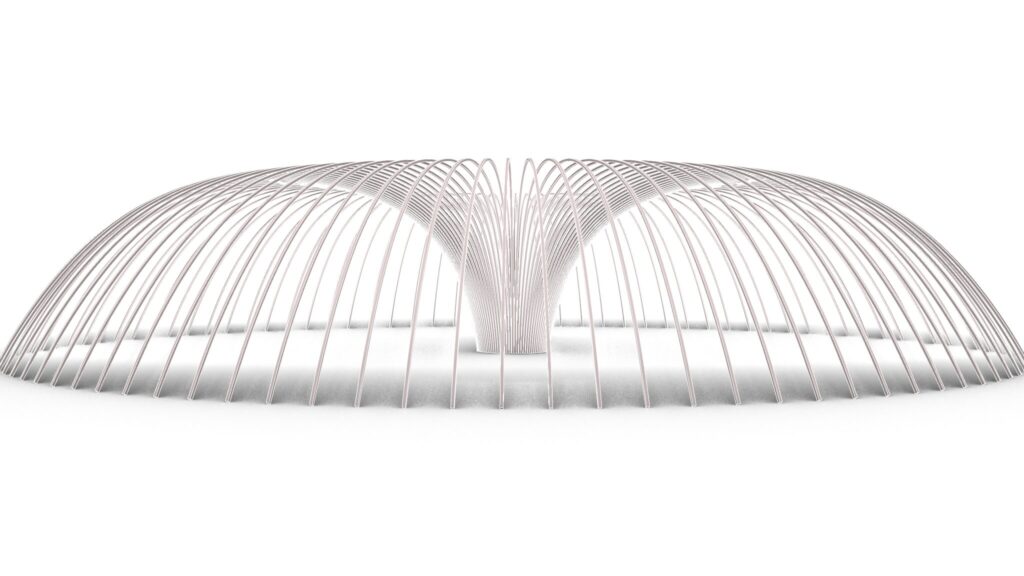
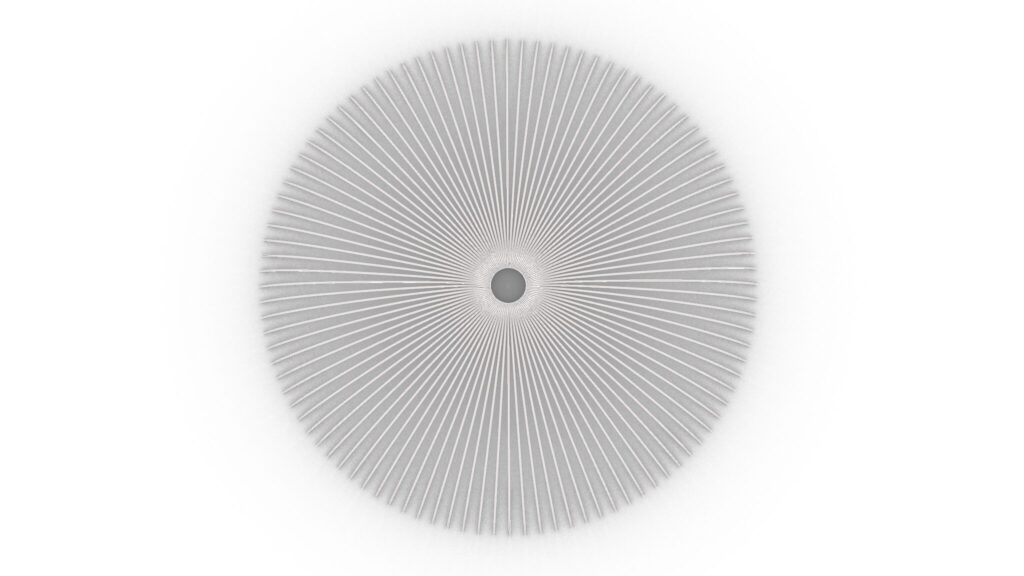
The top five images are from Grasshopper.
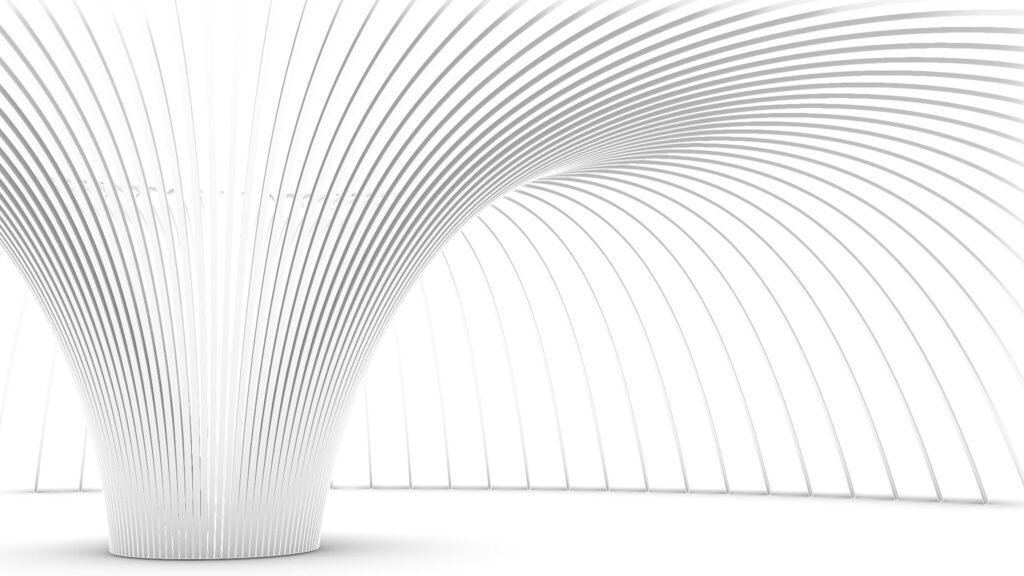
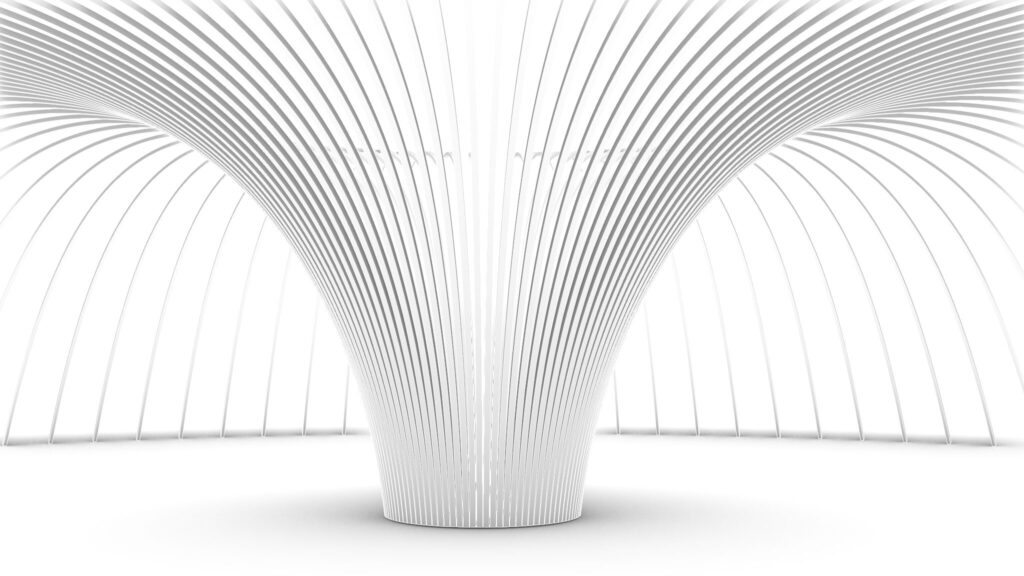
The top five images show the model exported on Rhinoceros.
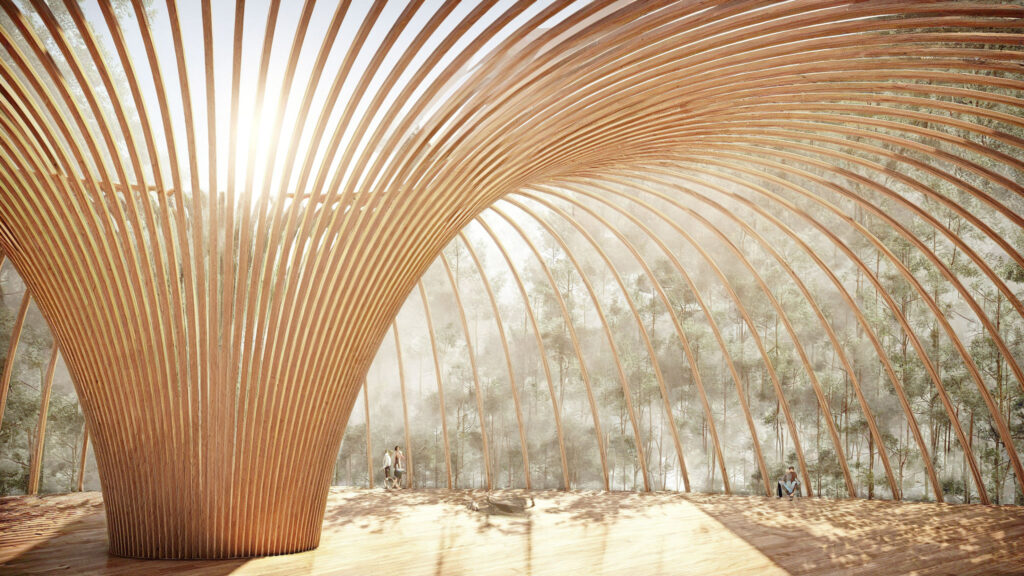
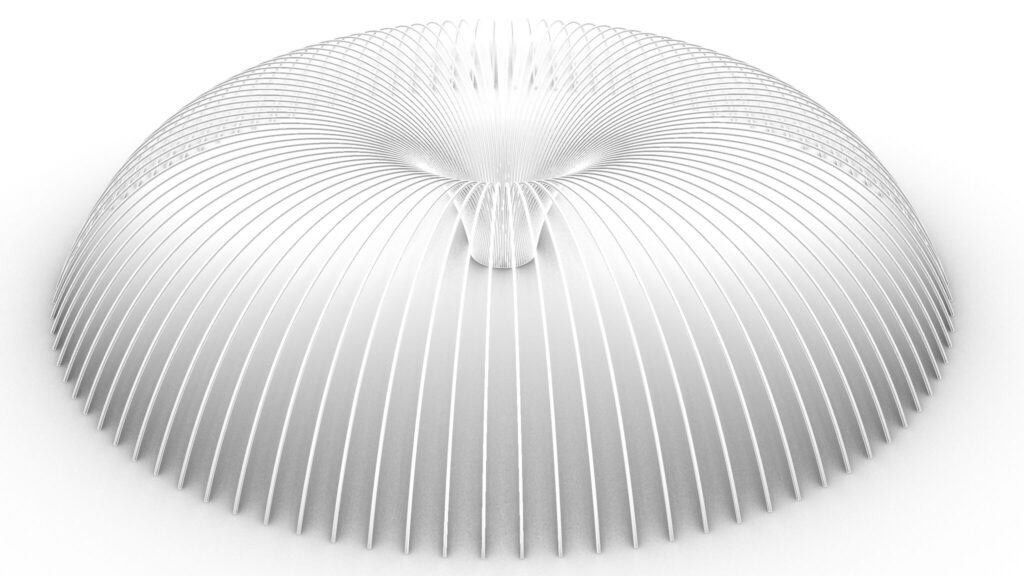
The image above shows the final rendering.
Click here to download the Grasshopper file
Please refer to the Terms of Use regarding the use of downloadable data.
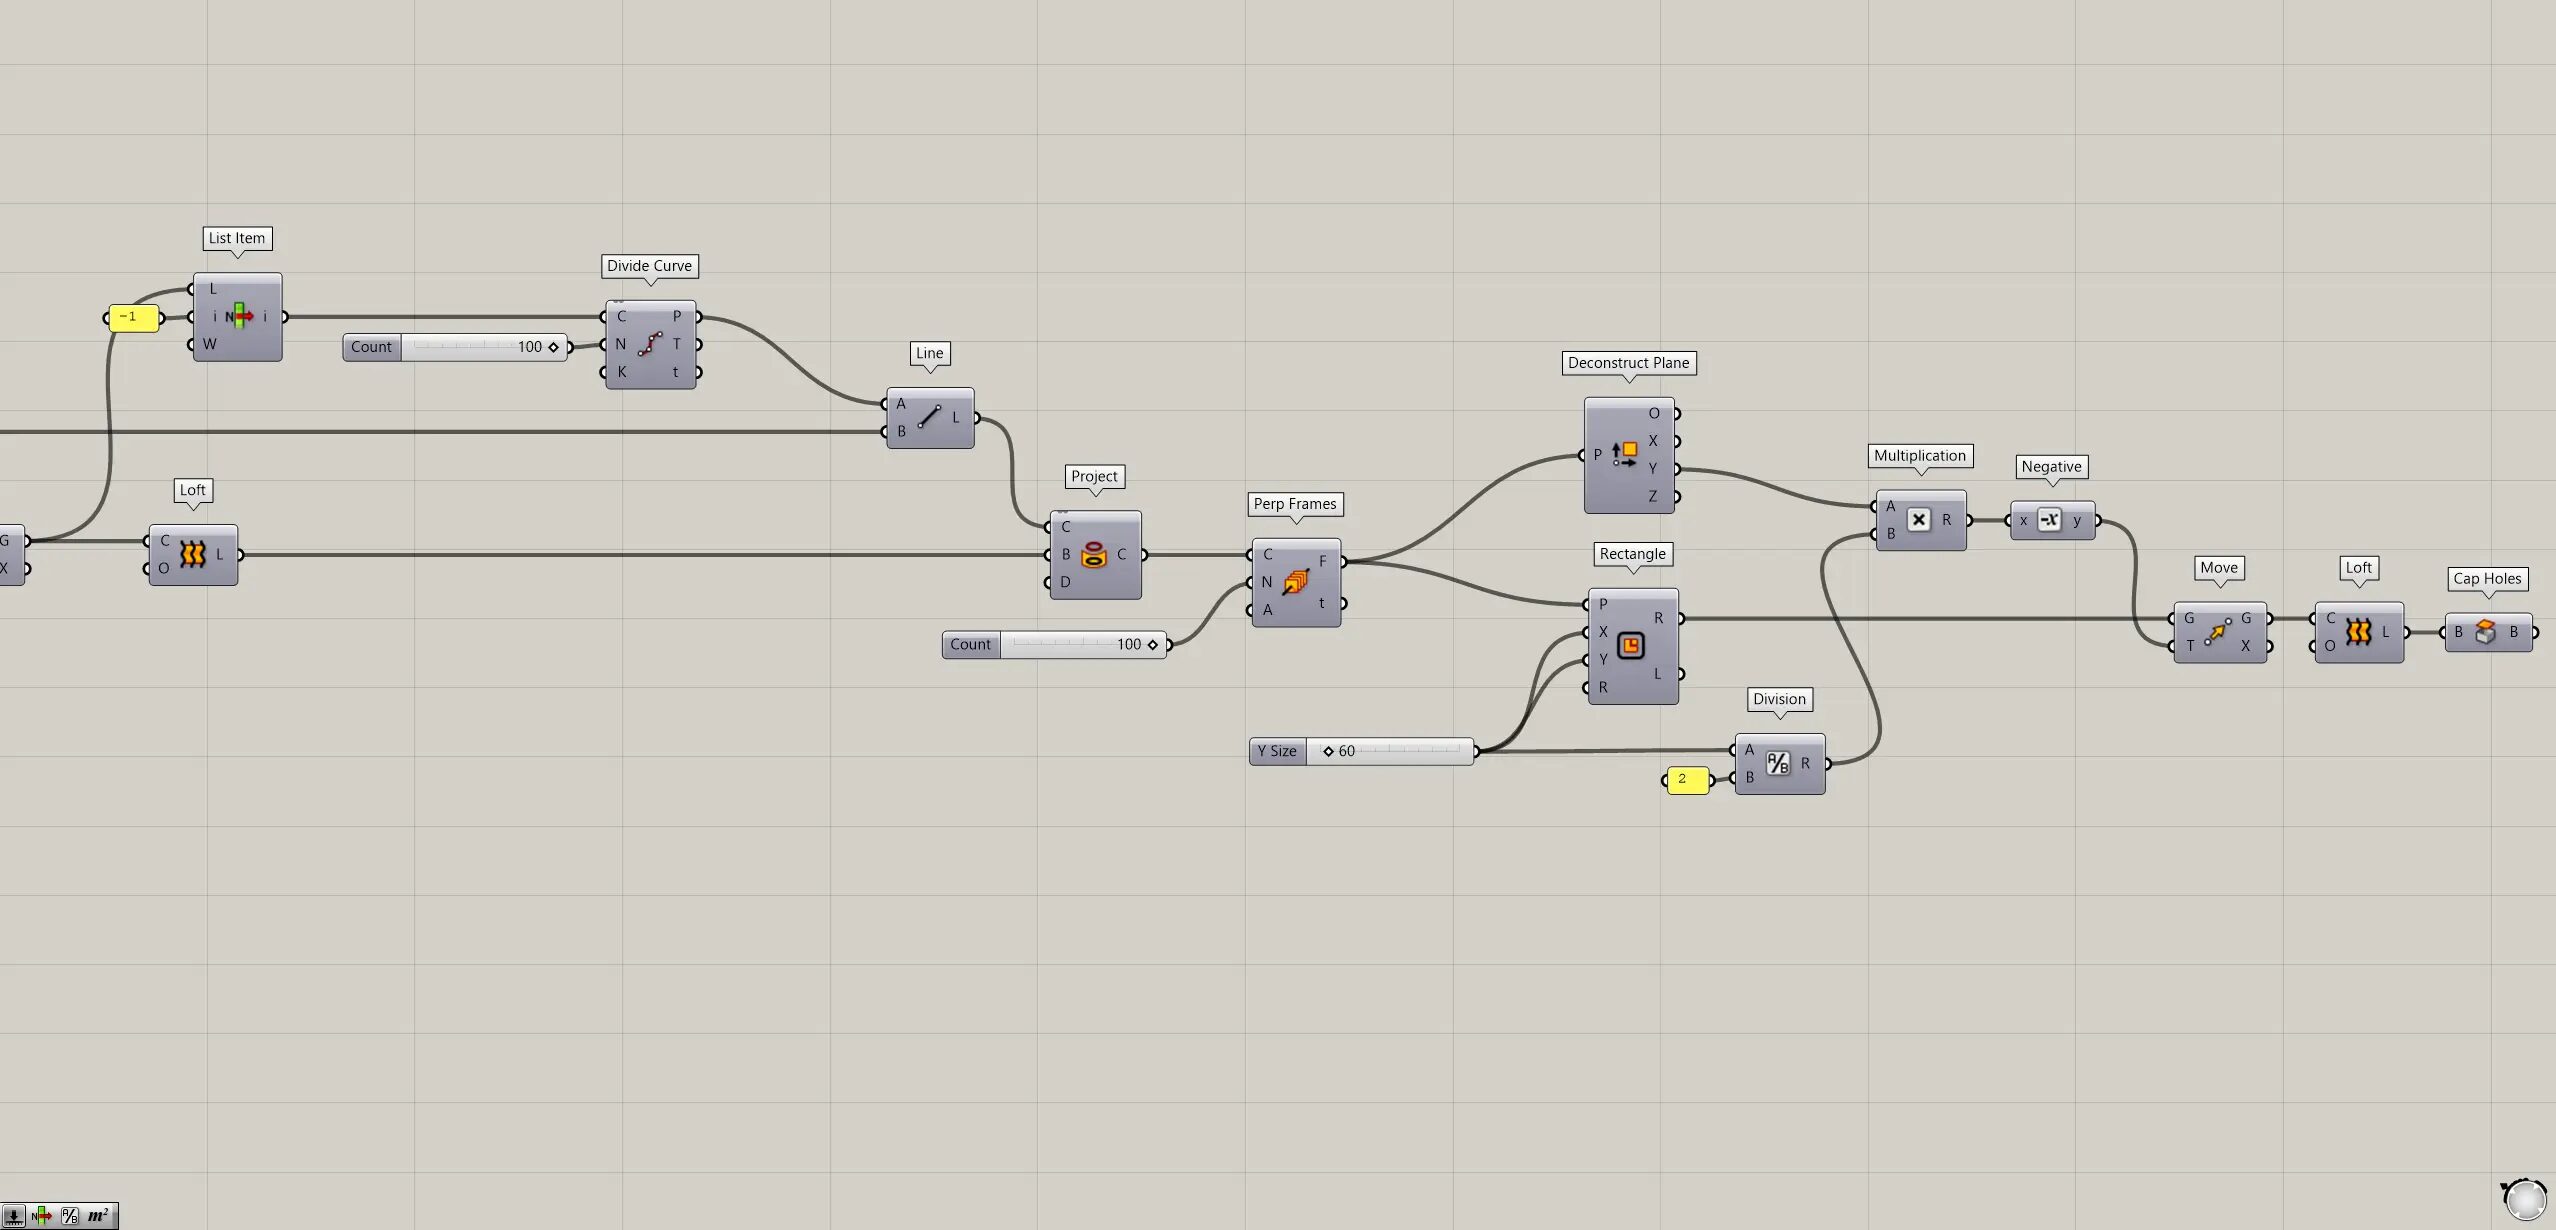
Grasshopper recipe
①Circle ②Area ③Division ④Addition ⑤Series ⑥Graph Mapper ⑦Bounds ⑧Construct Domain ⑨Remap Numbers ⑩Scale ⑪Unit Z ⑫Move ⑬Loft ⑭List Item ⑮Divide Curve ⑯Line ⑰Project ⑱Perp Frames ⑲Rectangle ⑳Deconstruct Plane ㉑Multiplication ㉒Negative ㉓Cap Holes

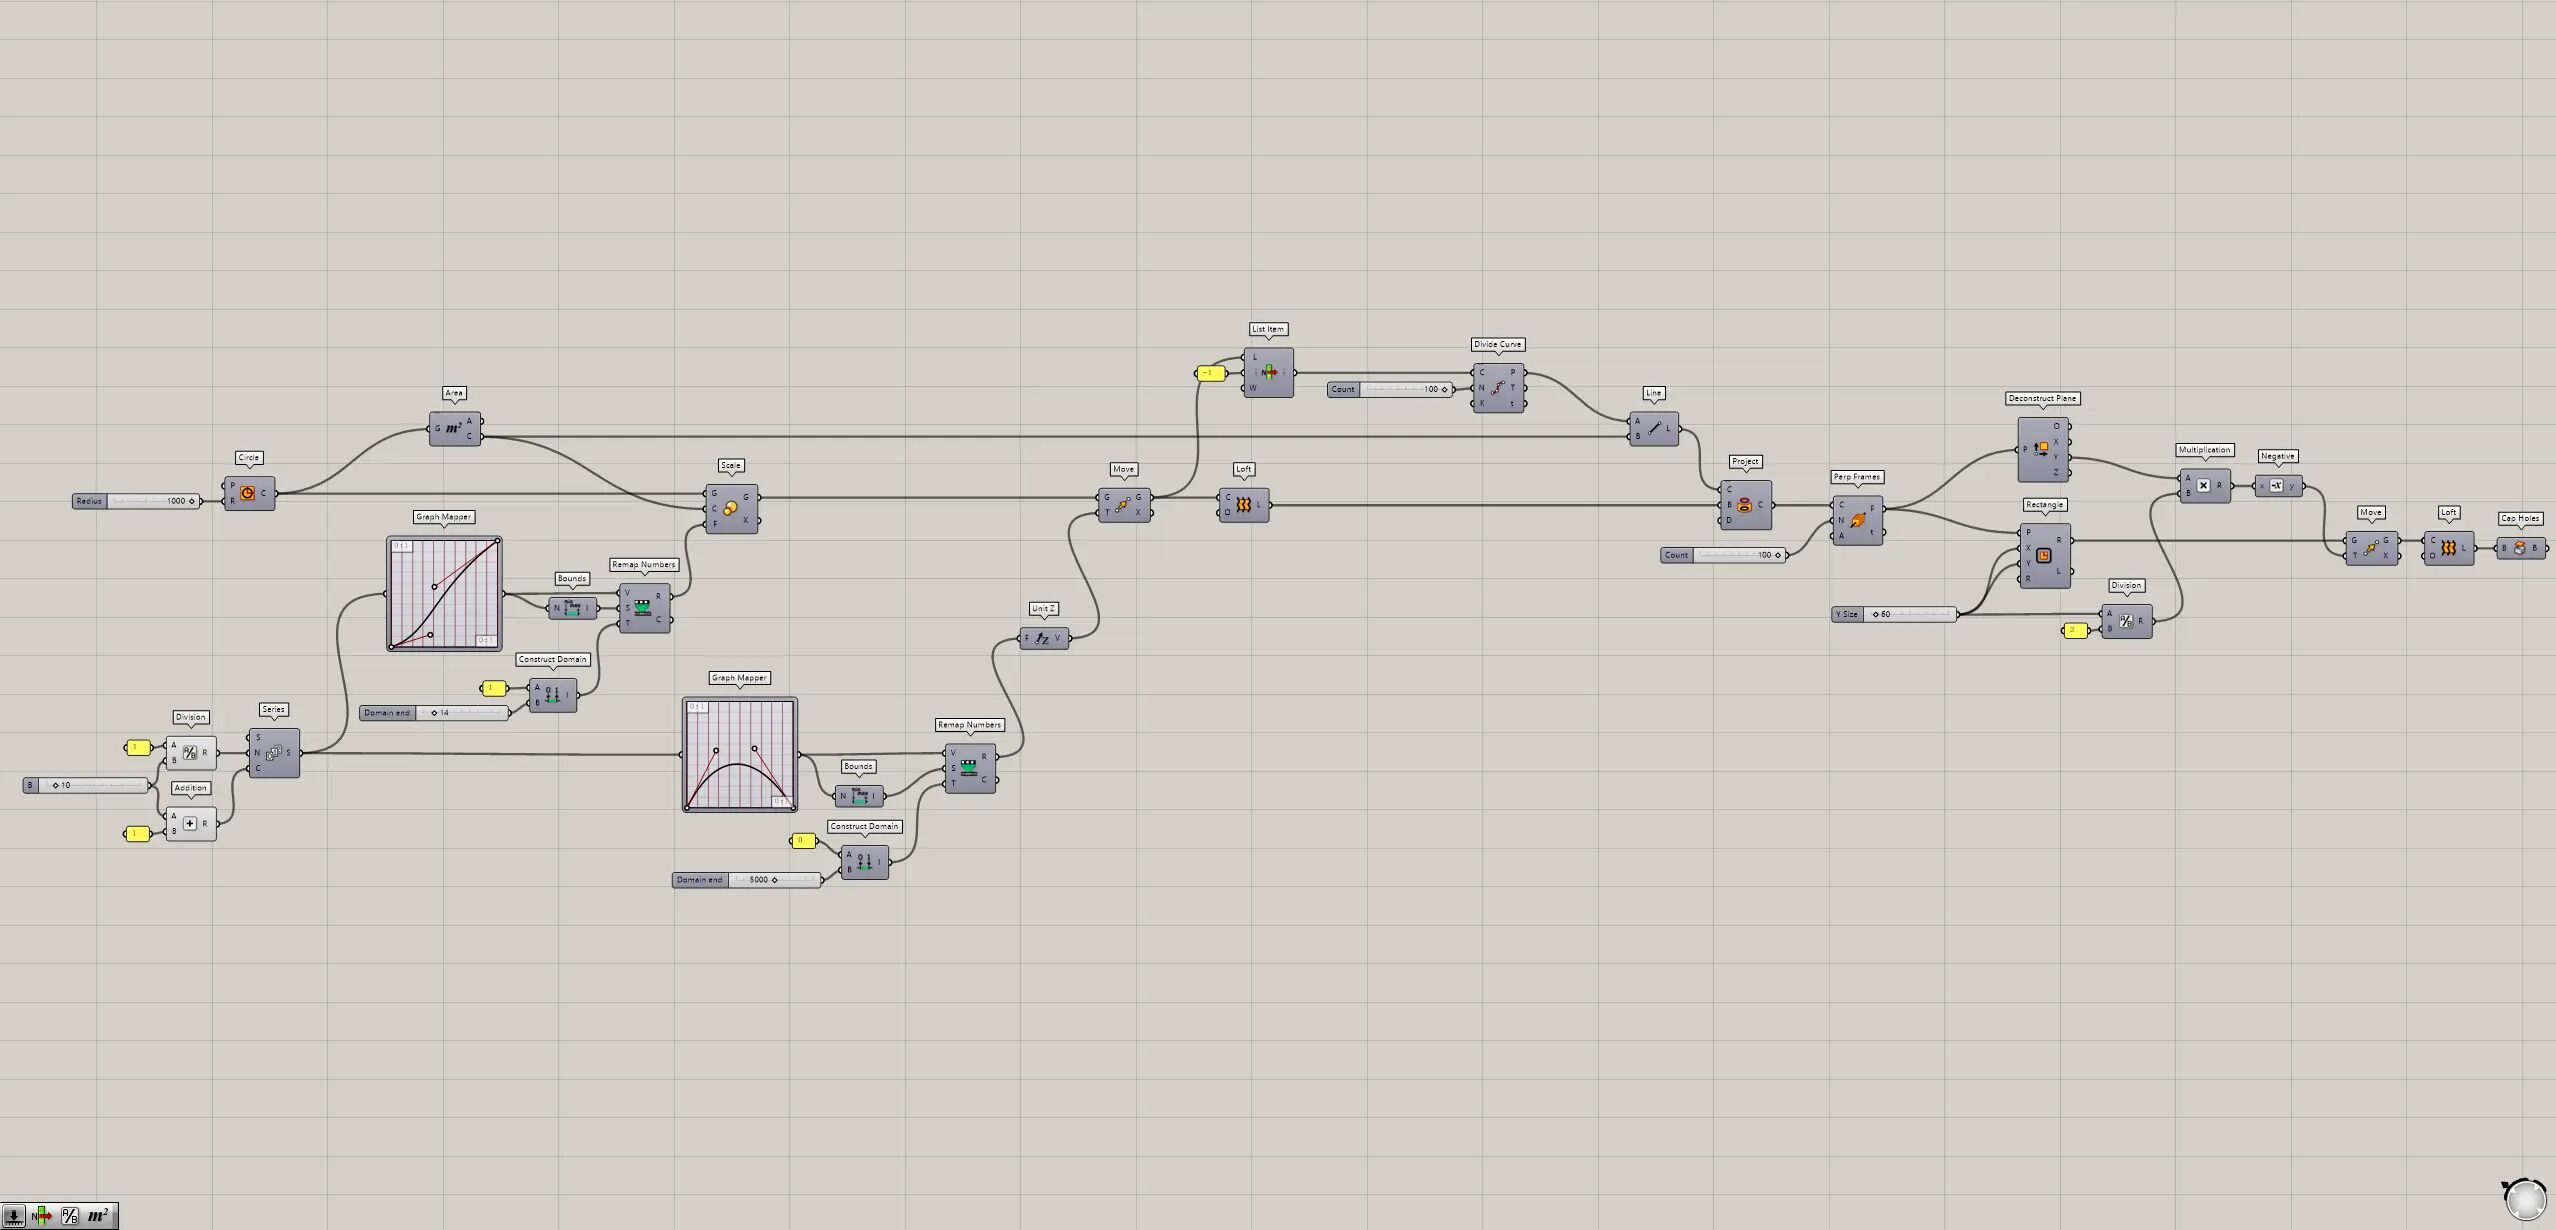
Create multiple circles of different scales
First, we will create multiple circles of different scales.
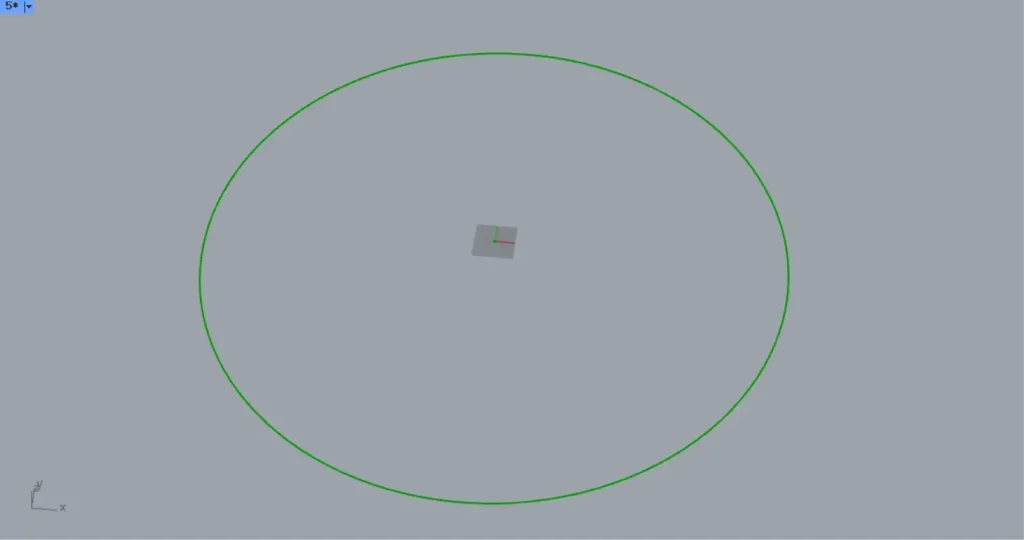
Enter a numerical value for the radius in a Circle(R).
This time, 1000 is entered.
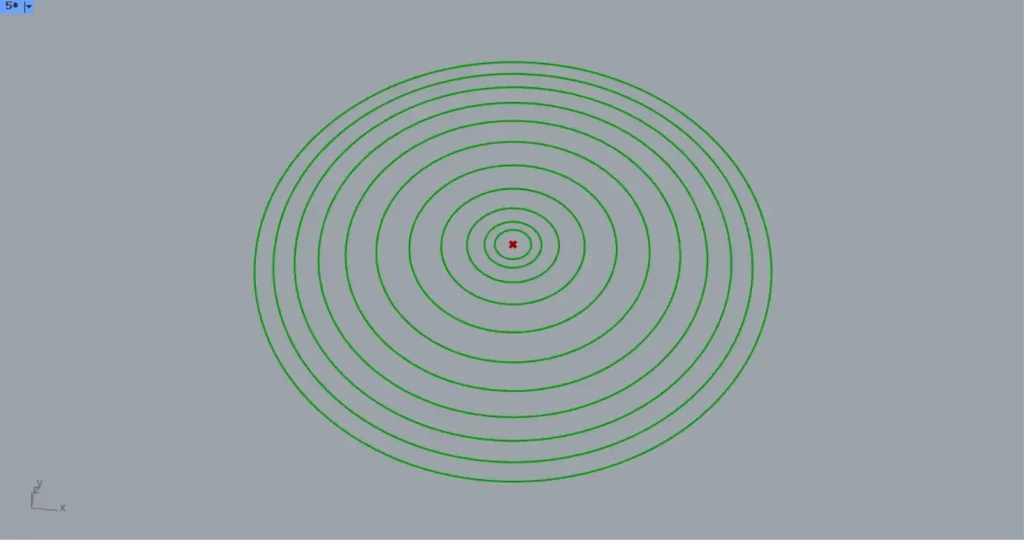
Then a circle with a radius of 1000 is created, as shown in the image above.
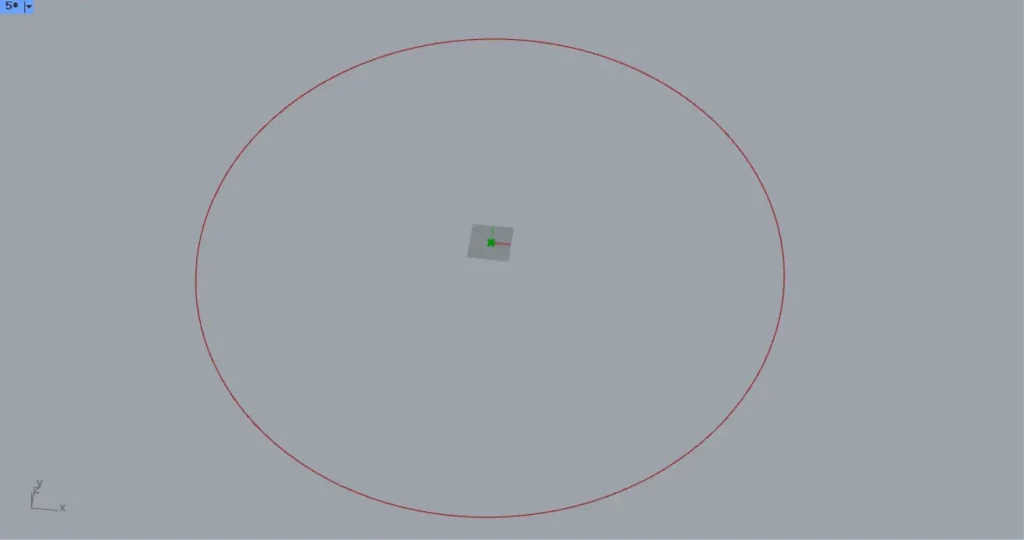
Then connect the Circle to an Area.
Then you can get the center point of the circle, as in the image above.
Next, we will create numerical values to change the scale of the circles.
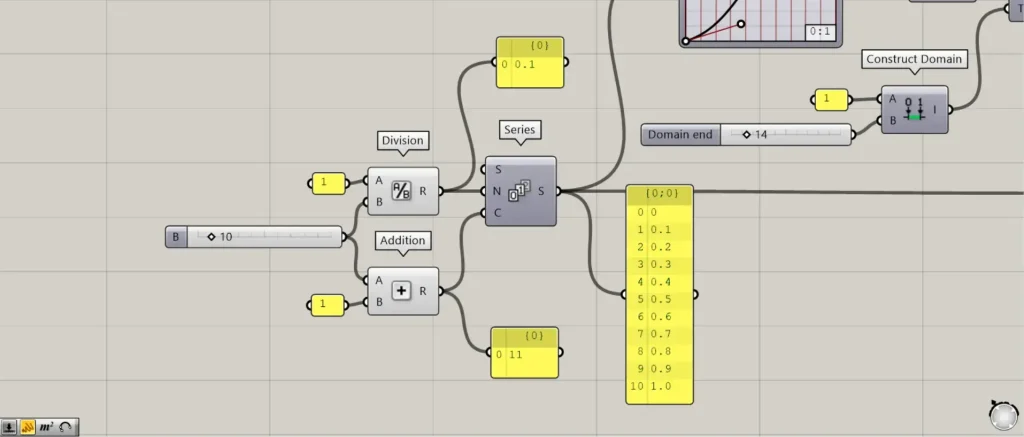
Prepare the numerical values for the number of circles you will eventually add.
In this case, 1 will be used.
Then we connect 10 to a Division(B).
Furthermore, connect 1 to the Division(A).
Then the number 1 divided by 10 = 0.1 is output.
Then connect the 10 and 1 from to an Addition.
Then the number 10+1=11 is output.
This number will be the final number of circles.
Then connect the Division to a Series(N).
In addition, connect the Addition to the Series(C).
Then 11 numbers are created, increasing by 0.1 from 0.
These numbers will be the X-axis numbers for the next graph we use.
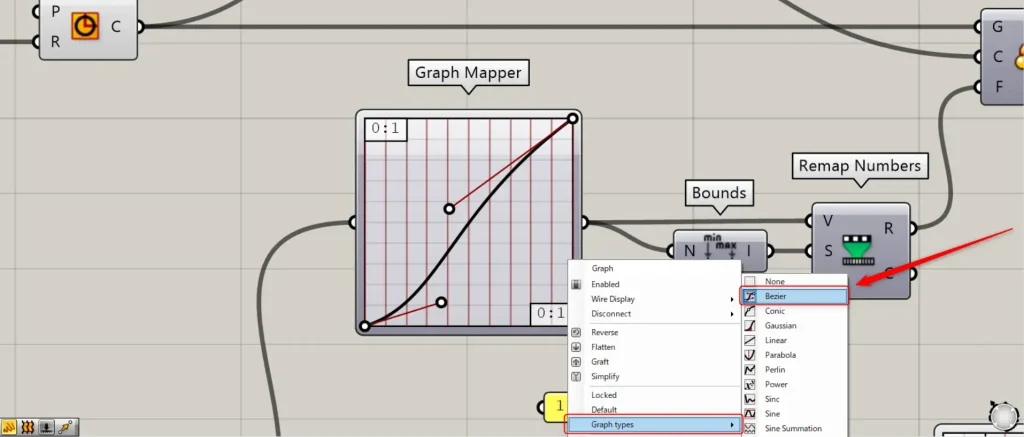
Then connect the Series to a Graph Mapper.
At this point, right click on the Graph Mapper and set it to Bezier.
Furthermore, set the shape of the graph to look like the image above.
This will output the Y-axis value of the graph corresponding to the X-axis value you entered.
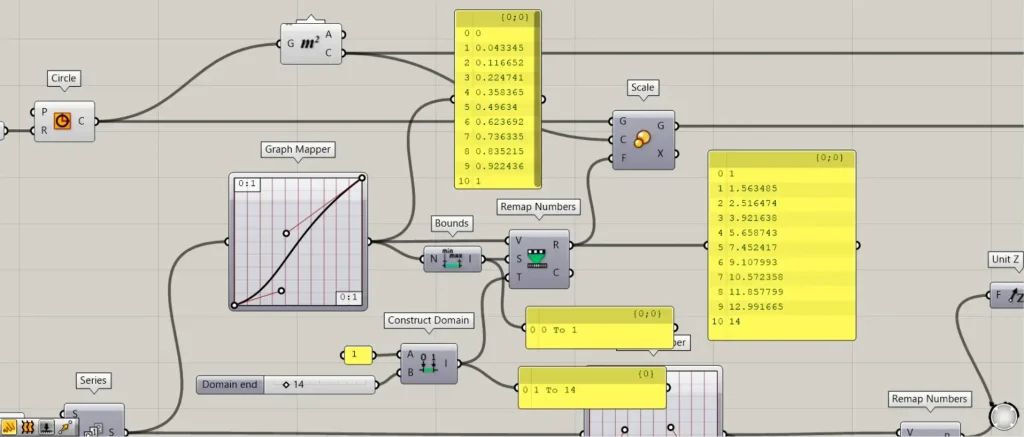
Then connect the Graph Mapper to a Bounds.
Then a numerical range is created from the minimum and maximum values of the numbers output from the Graph Mapper.
Then enter 1 in a Construct Domain(A).
In addition, enter any multiplier value in the Construct Domain(B).
In this case, we enter a numerical value of 14.
Then a numeric range of 1 To 14 is created.
Then connect the Graph Mapper to a Remap Numbers(V).
In addition, connect the Bounds to the Remap Numbers(S).
In addition, connect the Construct Domain to the Remap Numbers(T).
Then the values output from the Graph Mapper will change within the range of 1~14 numbers.
Then connect Remap Numbers(R) to Scale(F).
In addition, connect the Area to the Scale(C).
In addition, connect the Circle to the Scale(G).
Then the circle is duplicated, changing the scale of the circle, as shown in the image above.
Move each circle straight up to create a surface connecting each circle
Next, we will create a surface connecting each circle by moving each circle straight up.
First, we will create the numbers that will move each circle directly upward.
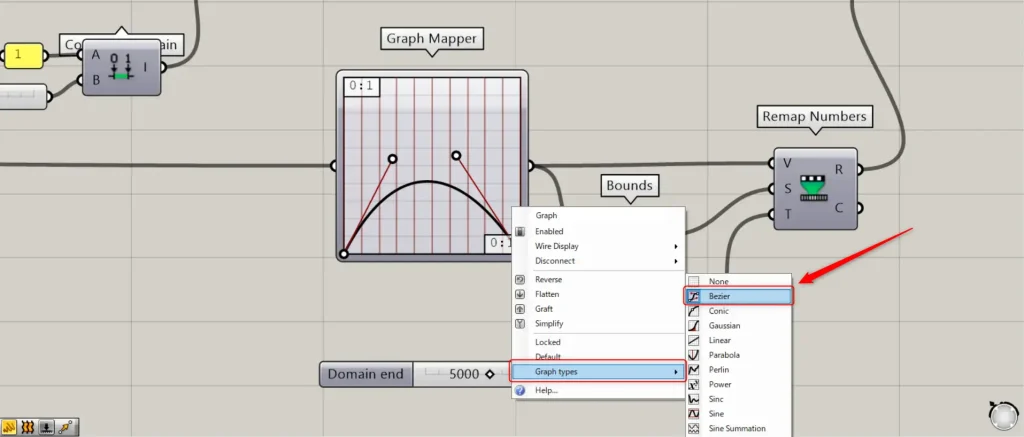
Connect the Series we just created to a new Graph Mapper.
At this point, right click on the Graph Mapper and set it to Bezier.
Then, as before, the Y-axis value of the graph corresponding to the X-axis value you entered will be output.
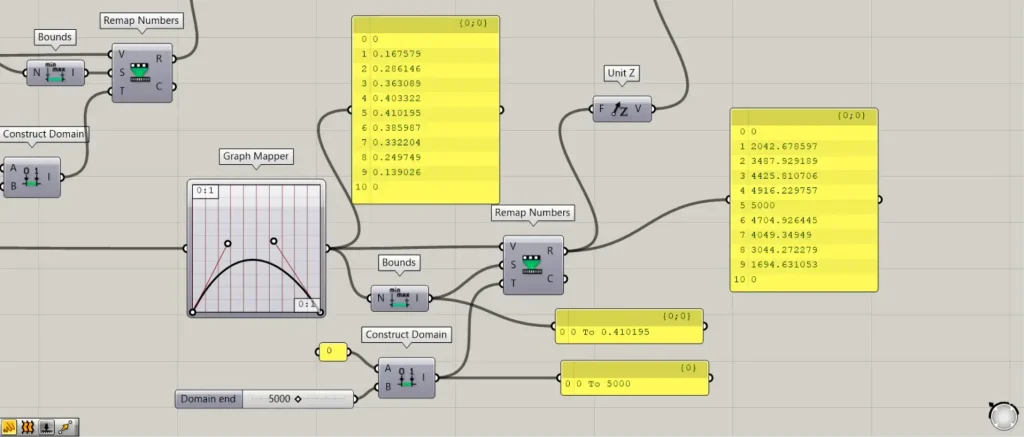
Then connect the Graph Mapper to a Bounds.
Then a numerical range is created from the minimum and maximum values of the numbers output from the Graph Mapper.
Then enter a number 0 in a Construct Domain(A).
In addition, enter any maximum height value in the Construct Domain(B).
In this case, 5000 is entered.
Then a numeric range of 0 To 5000 is created.
Then connect the Graph Mapper to a Remap Numbers(V).
In addition, connect the Bounds to the Remap Numbers(S).
In addition, connect the Construct Domain to the Remap Numbers(T).
Then the values output from the Graph Mapper will change within the range of 0~5000.
Then connect the Remap Numbers(R) to an Unit Z.
Then connect the Unit Z to Move(T).
In addition, connect the Scale(G) to the Move(G).
Then each circle moves directly upward, as shown in the image above.
Then connect the Move(G) to a Loft(C).
Then a surface is created by connecting the line data of each circle, as shown in the image above.
Project radial lines onto the surface
Next, radial lines are created and projected onto the surface.
Connect the Move(G) to a List Item(L).
In addition, connect -1 to the List Item(i).
Then you can get the line data of the last large circle from each circle, as shown in the image above.
Then connect the List Item to Divide Curve(C).
Furthermore, connect any number of divisions to the Divide Curve(N).
This time, 100 is entered.
Then points are created at the positions where the line is divided by 100, as shown in the image above.
Then connect the Area(C) and the Divide Curve(P) to a Line.
Then lines are created connecting the division points and the center point of the circle, as shown in the image above.
Then connect the Line to a Project(C).
In addition, connect the Loft to the Project(B).
Then lines are projected on the surface, as shown in the image above.
Create louvers from the projected curves.
Finally, Create louvers from the projected curves.
Connect the Project to the Perp Frames(C).
Furthermore, connect the number of planes to a Perp Frames(N).
This time, 100 is entered.
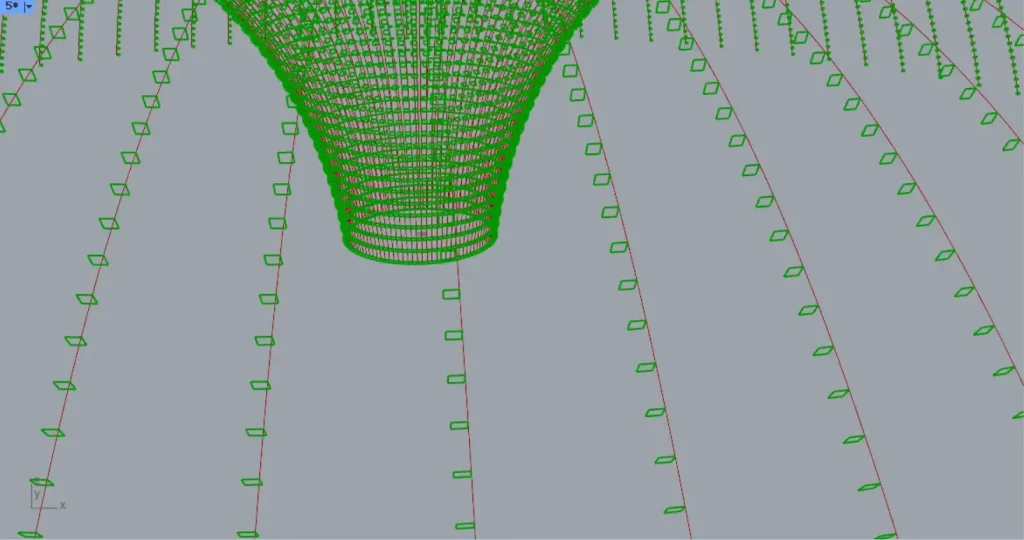
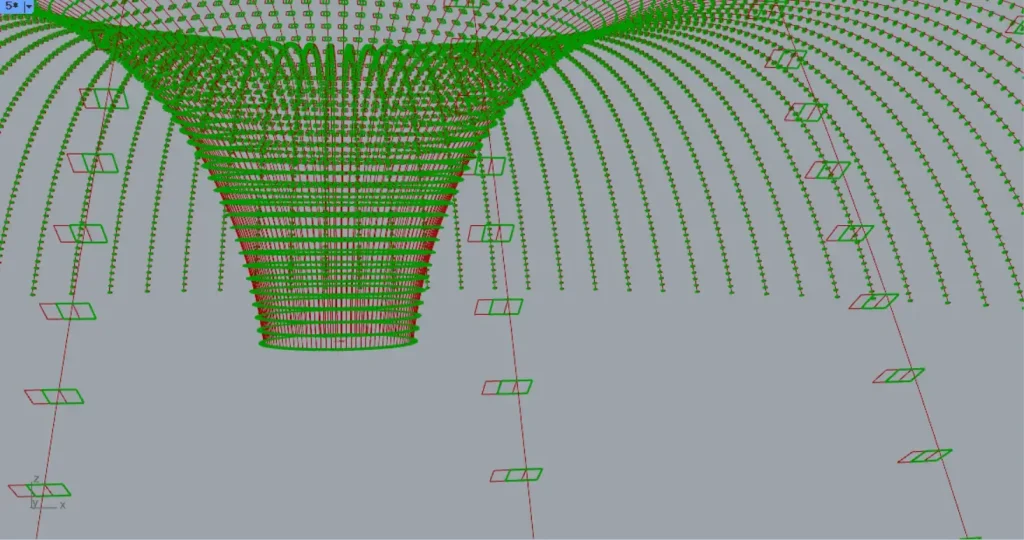
Then 100 planes are created on the curves.
Then connect the Perp Frames(F) to a Rectangle(P).
Furthermore, connect the side length values to the Rectangle(X and Y).
This time, 60 is entered for both.
Then square lines are created on the curves, as shown in the image above.
Then connect the Perp Frames(F) to a Deconstruct Plane.
Then you can get the vector data of X, Y and Z axes of each work plane.
Then connect 60 values to a Division(A).
Furthermore, connect 2 to the Division(B).
Then the number 60÷2=30 is output.
Then connect the Deconstruct Plane(Y) and the Division to a Multiplication.
Then connect the Multiplication to a Negative.
This will multiply the number entered by a negative number.
Then connect the Negative to a Move(T).
In addition, connect the Rectangle(R) to the Move(G).
Then we moved the squares so that its centers are directly under the curves, as shown in the image above.
Then connect the Move(G) to a Loft(C).
Then a surface is created that connects the square lines, as shown in the image above.
Then connect the Loft to a Cap Holes.
Then the holes at both ends close.
This completes the process.
That’s all.

Comment