
![[Grasshopper] How to use Proximity 3D to create lines connecting nearby points](https://iarchway.com/wp-content/uploads/2026/01/eyecatch-21.png)
This article explains how to use Proximity 3D to create lines connecting nearby points.
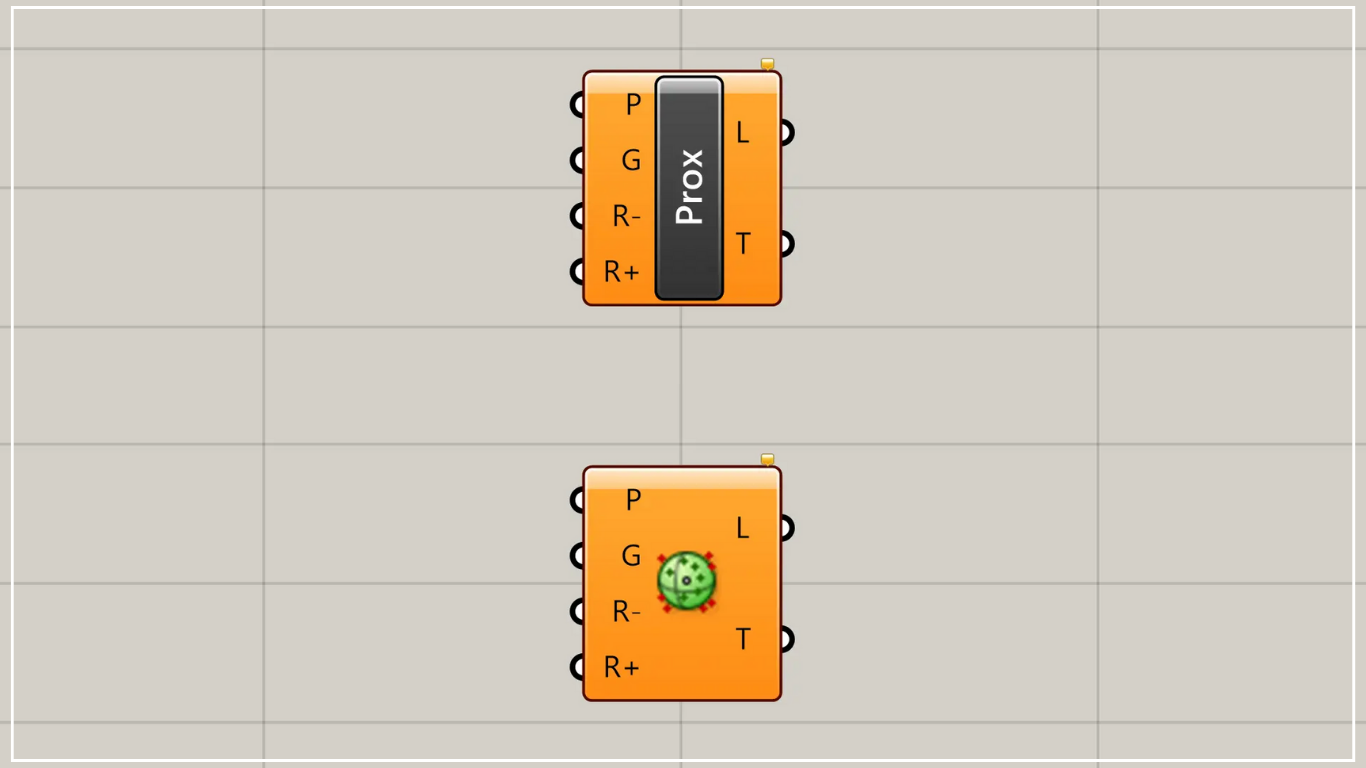
On the Grasshopper, it is represented by either of the two above.
Create lines connecting nearby points
Using Proximity 3D, you can create lines connecting nearby points.
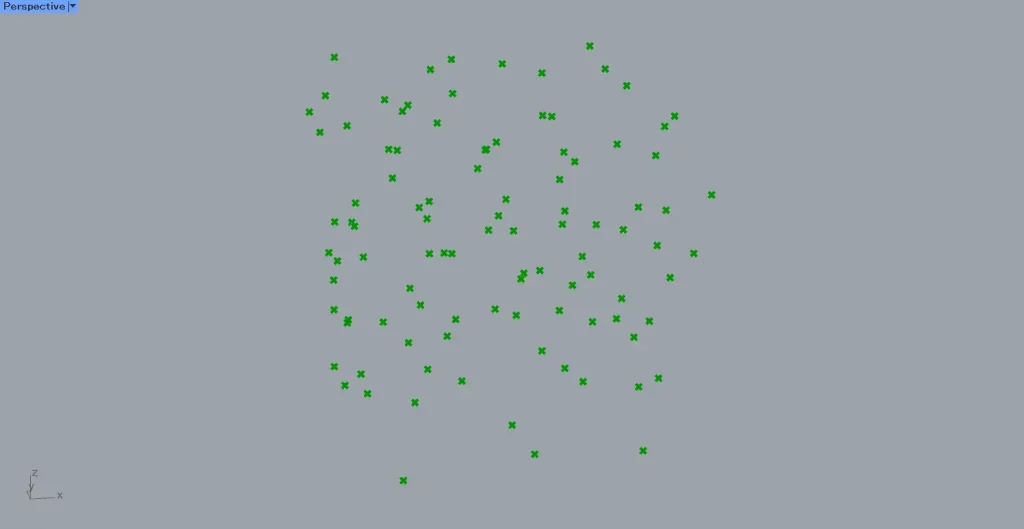
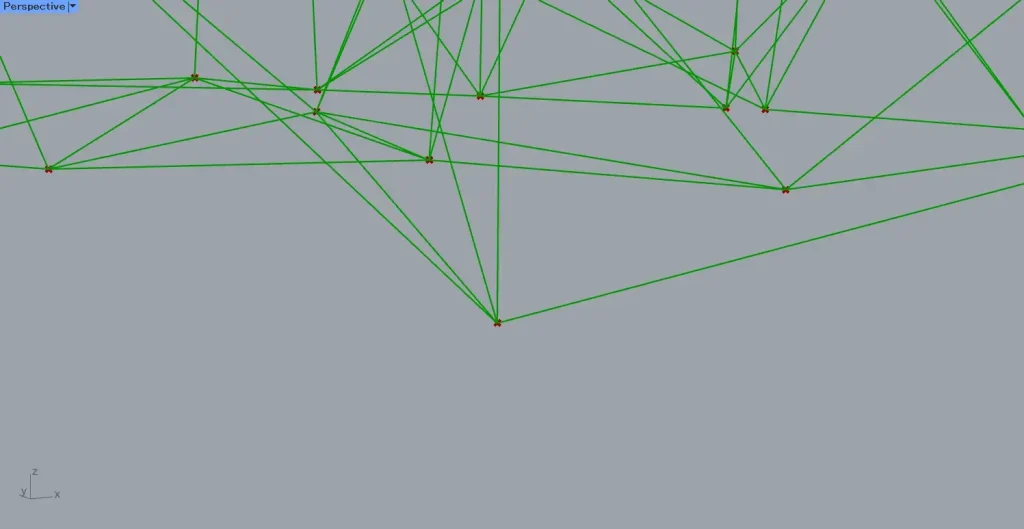
This time, we will use the multiple point data shown in the image above.
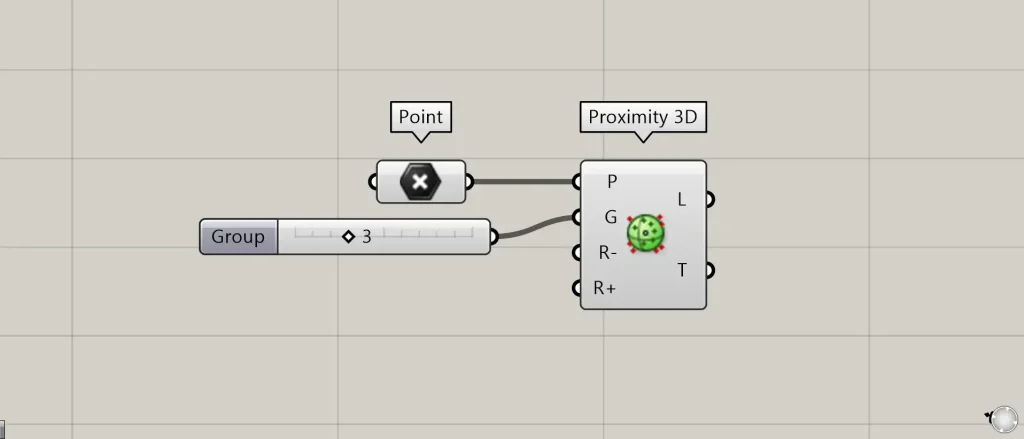
Components used: ①Point ②Proximity 3D
Connect multiple point data to Proximity 3D(P).
This time, we are connecting multiple point data set in Point.
Connect the number of lines connecting nearby points from each point to Proximity 3D(G).
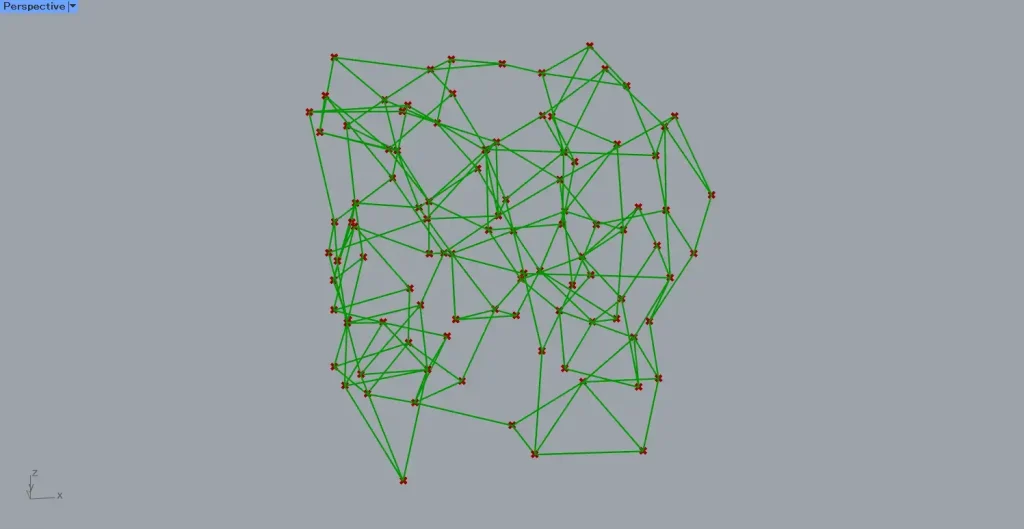
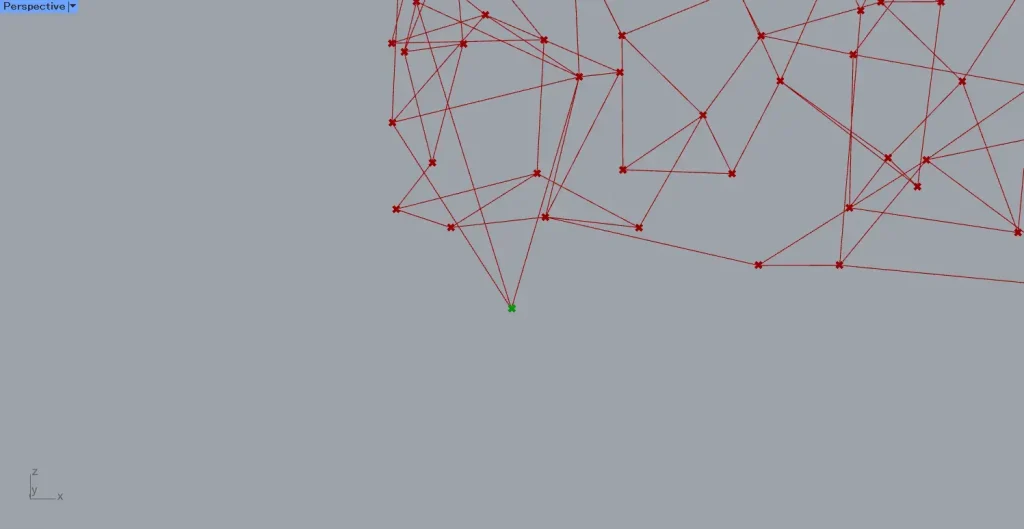
This time, since we are connecting three, lines will be created connecting each point to the three nearest points, as shown in the image above.
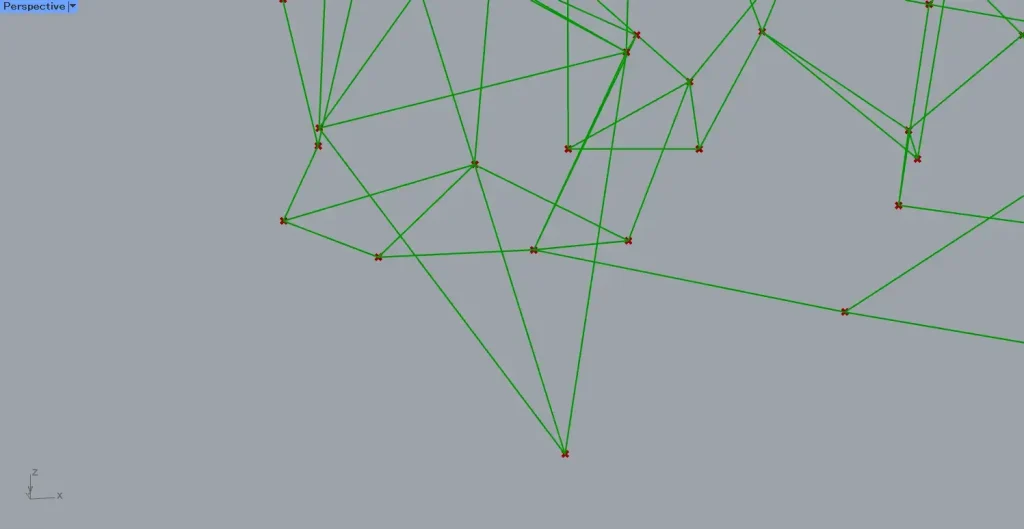
Zooming in reveals that, as shown in the image above, lines are created extending from one point to three nearby points.
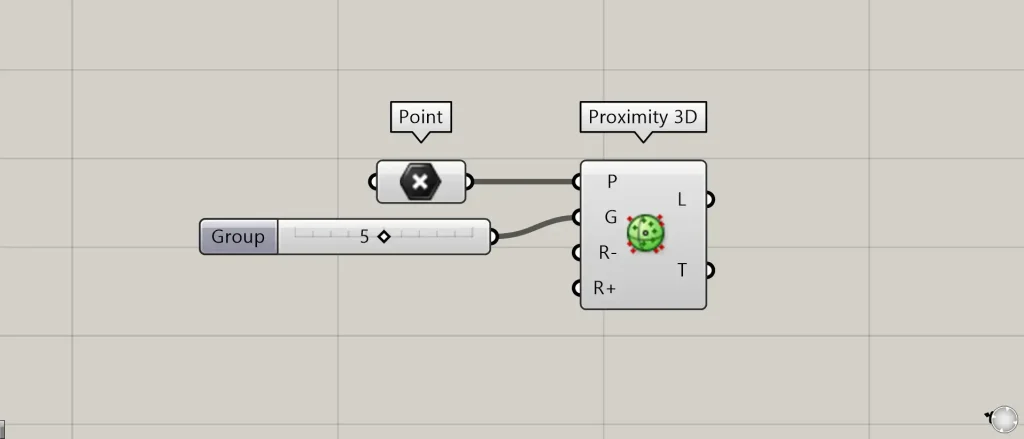
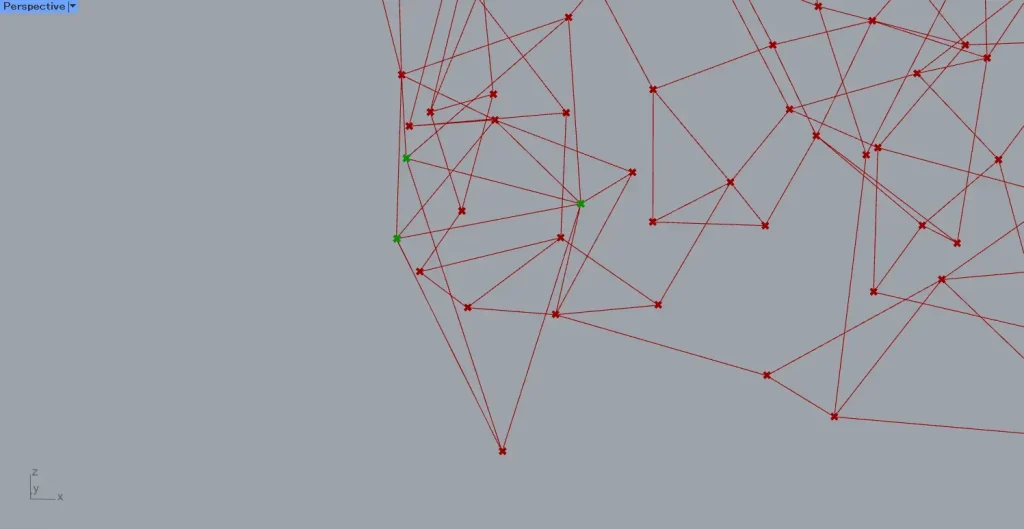
Let’s change the Proximity 3D(G) value from 3 to 5.
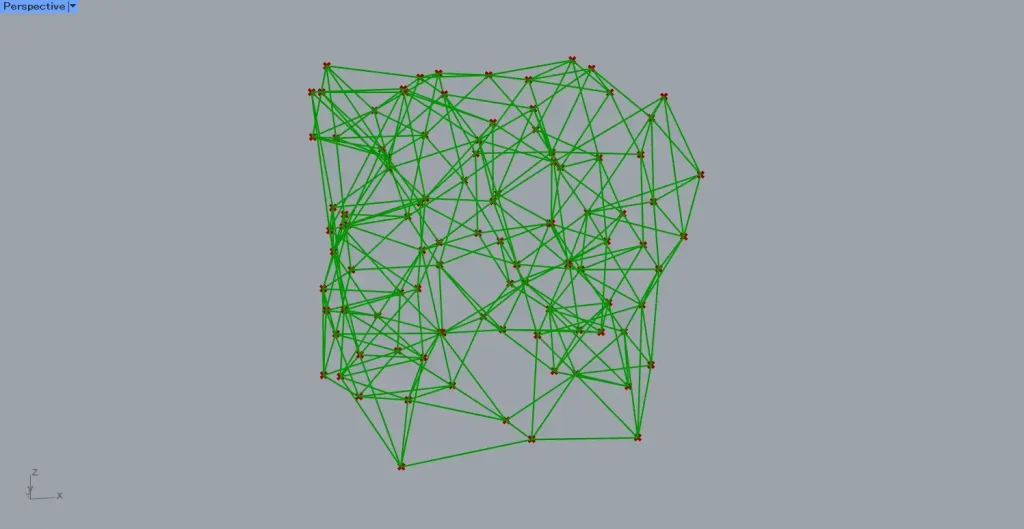
As shown in the two images above, you can see that the number of lines created from each point has changed from 3 to 5.
In this way, Proximity 3D(G) allows you to set the number of lines connecting nearby points from each point.
Specify the radius to define the range within which lines are created
You can also specify the range within which lines are created by defining the radius.
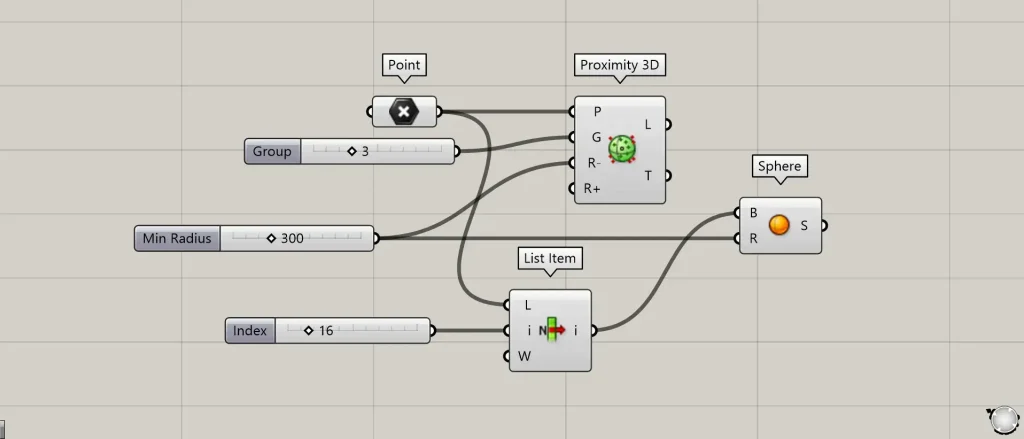
Additional Components: ①List Item ②Sphere
Using List Item, we’ll retrieve a single point and create a sphere at that point’s location to see what happens.
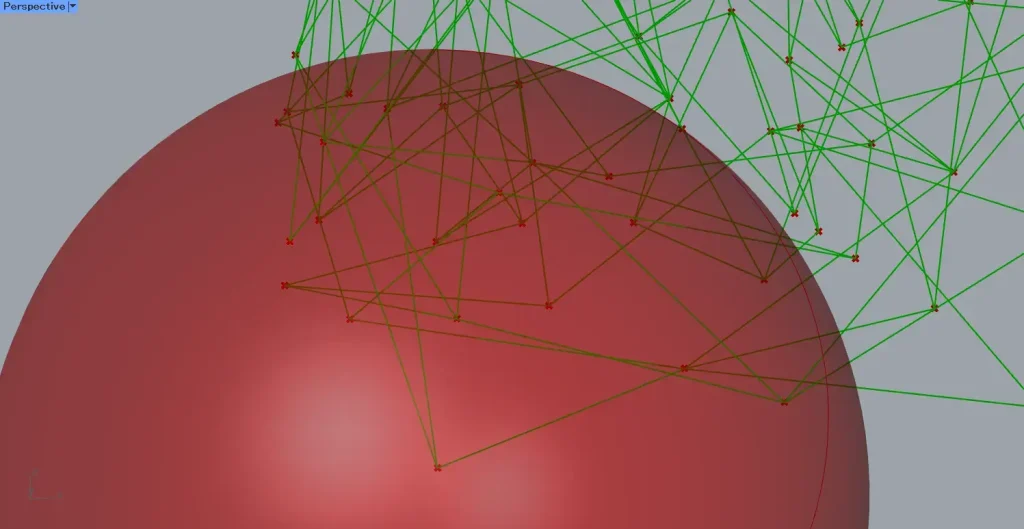
In Proximity 3D(R-), a specified radius is treated as the minimum value, and no lines are created within that radius.
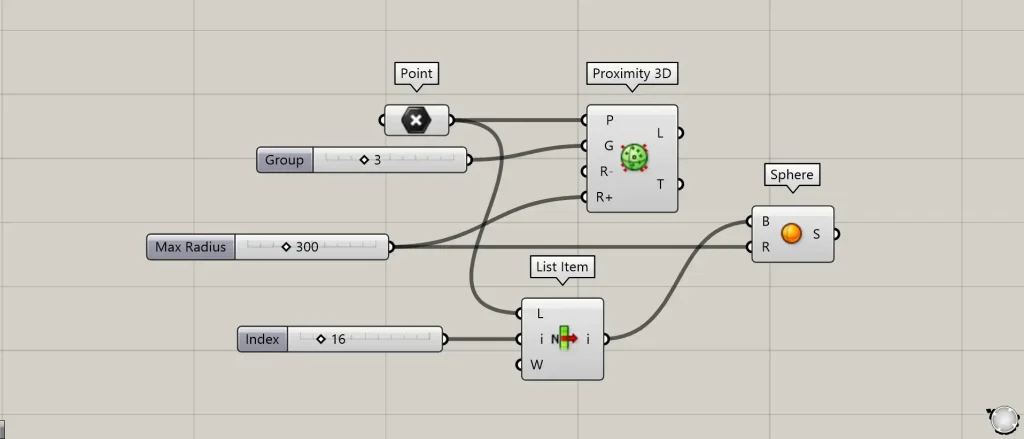
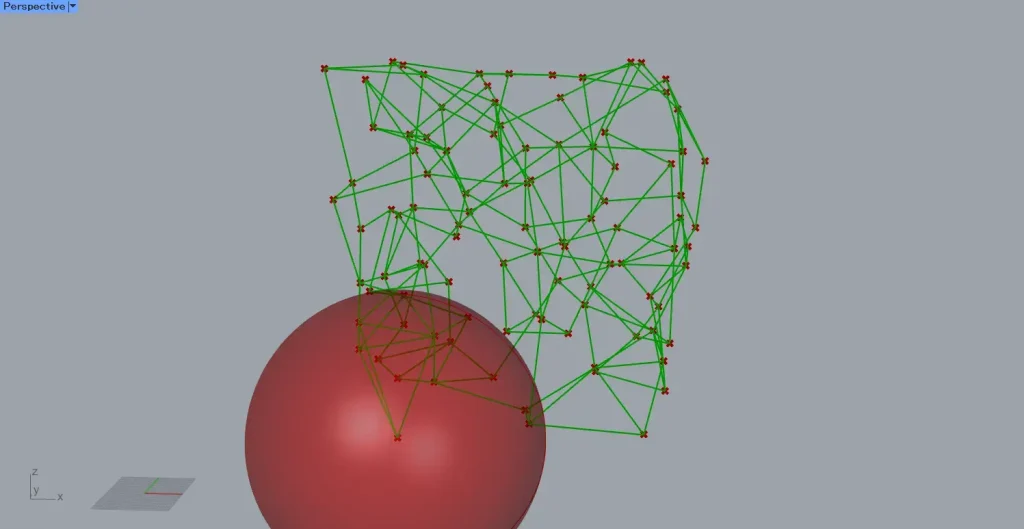
In Proximity 3D(R+), lines will only be created within a specified radius, with that radius serving as the maximum value.
Output data
Let’s take a look at the data output from Proximity 3D.
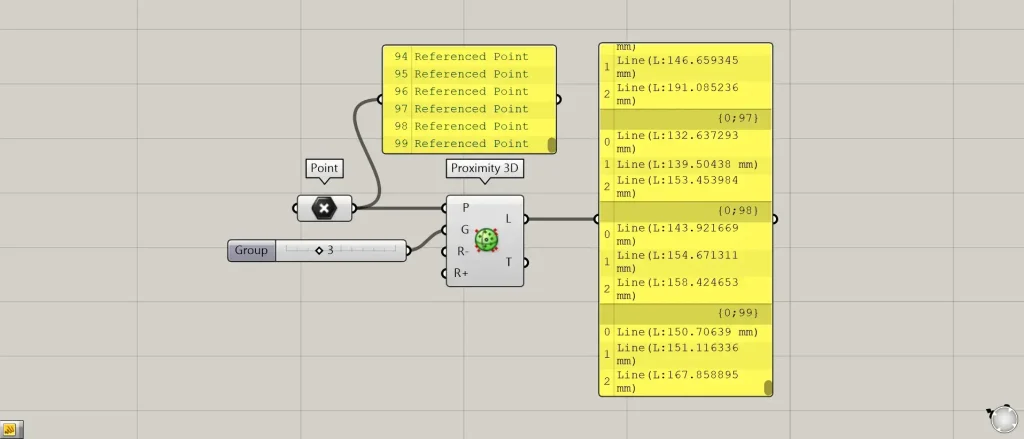
Proximity 3D(L) outputs the created line data.
Proximity 3D(T) outputs the index numbers of the points connecting each point.
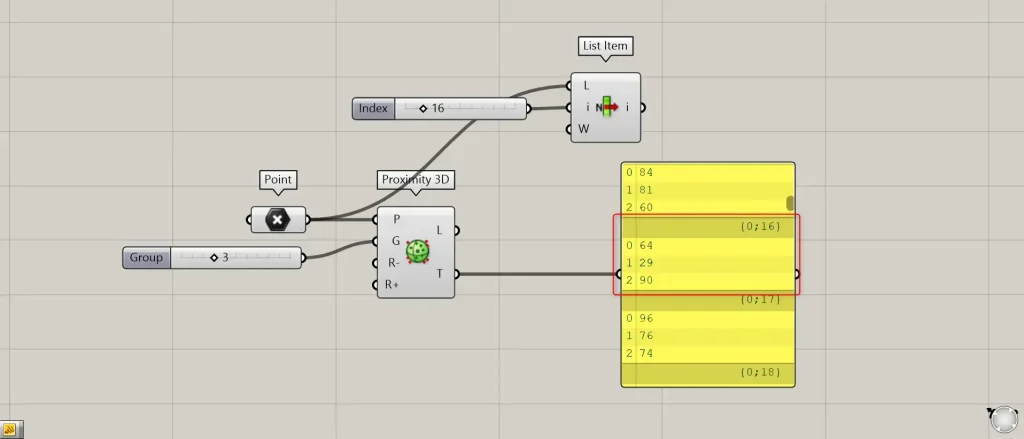
This time, let’s try retrieving the 16th point from the List Item.
Looking at the {0;16} branch of Proximity 3D(T), three numerical values are displayed.
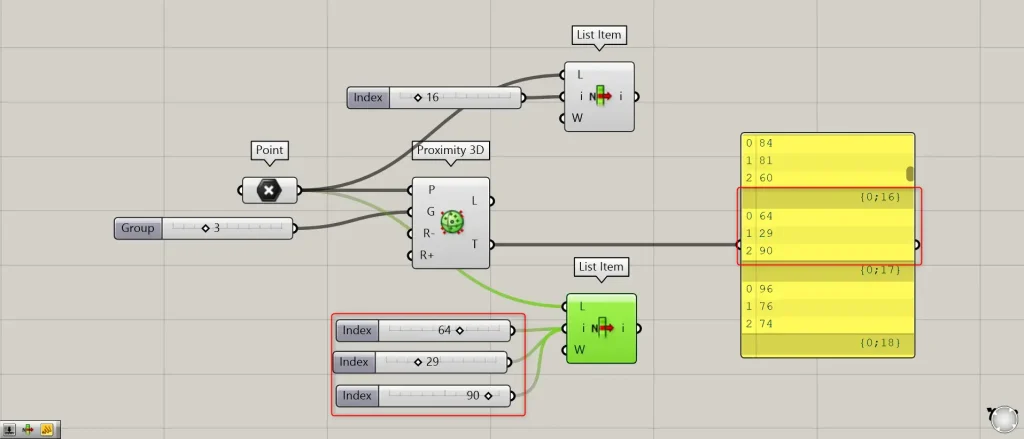
Let’s enter the same three numbers into List Item(I).
The image above shows the 16th point acquired first.
The image above shows points obtained from numerical data output by Proximity 3D(T).
Then, we can see that it is the endpoint of the line extending from the first point obtained.
Thus, Proximity 3D(T) outputs the index numbers of the points connecting each point.
List of Grasshopper articles using Proximity 3D component↓

Comment