
![[Grasshopper]木の幹と枝を作成する方法[データも配布]](https://iarchway.com/wp-content/uploads/2025/03/ViewCapture20250327_163105-1.jpg)
In this article, we will learn how to create a tree trunk and branches in Grasshopper.
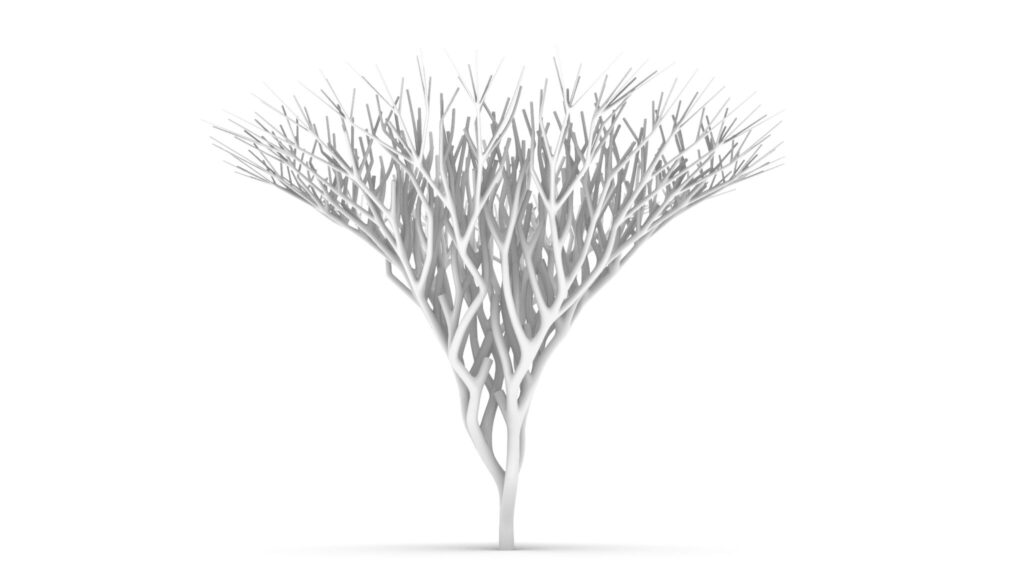
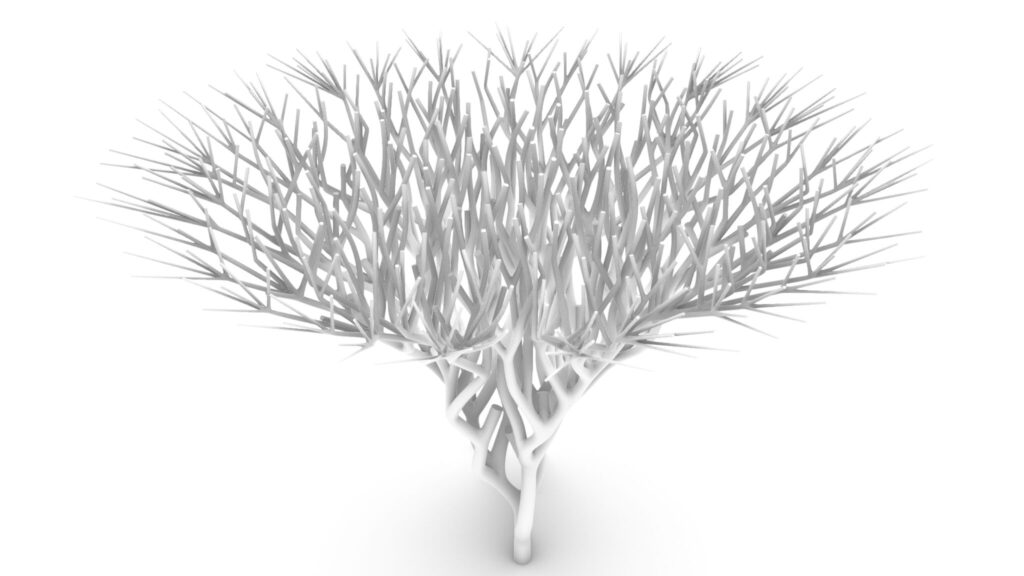
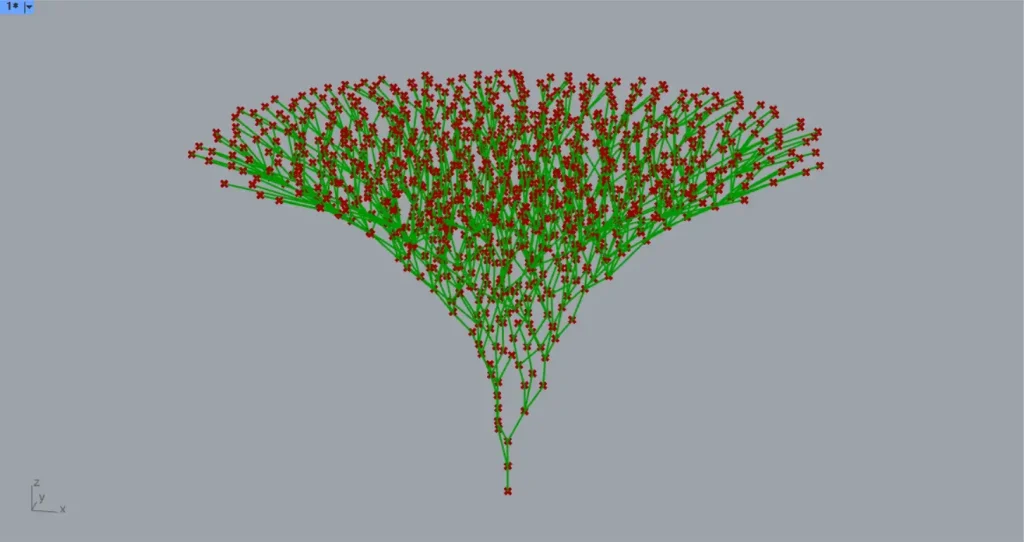
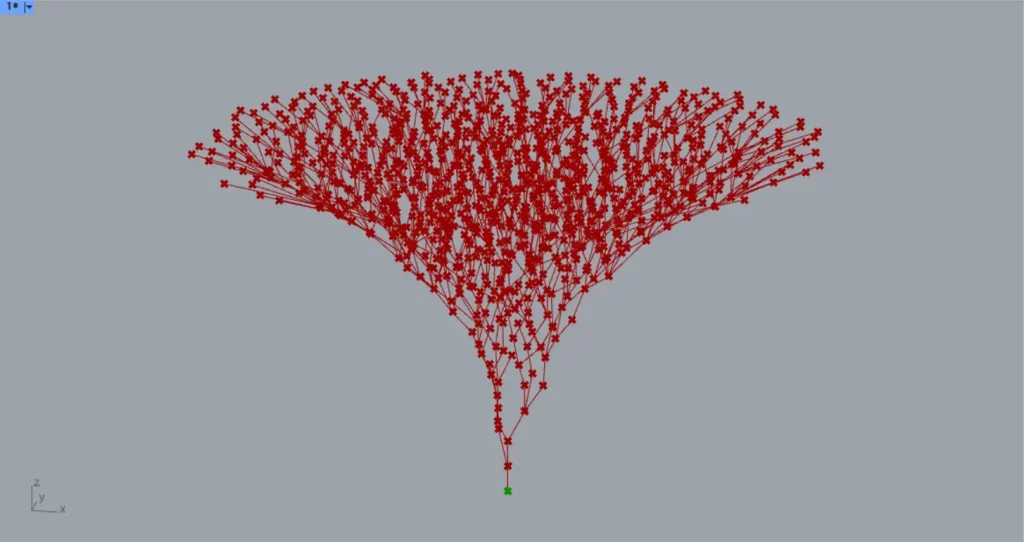
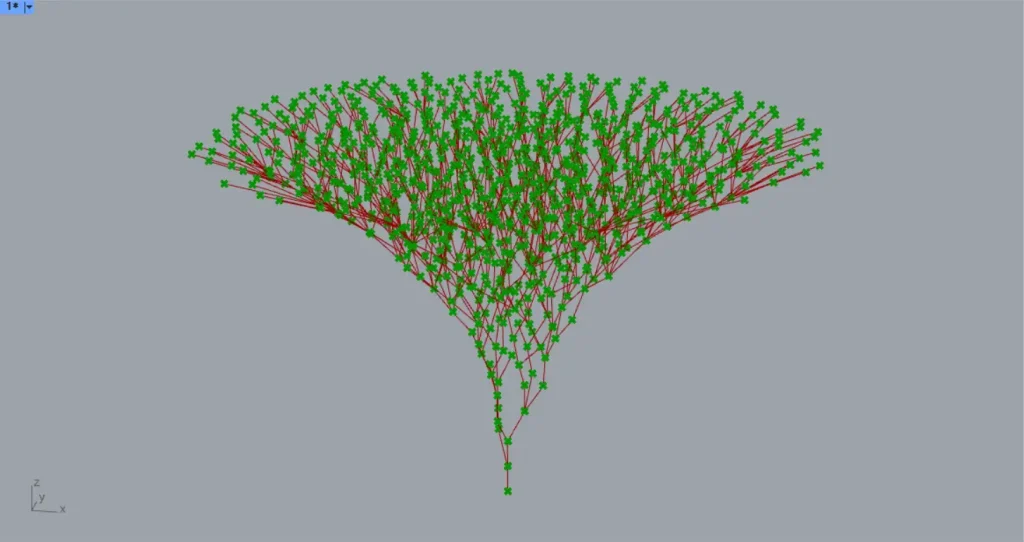
Model Images
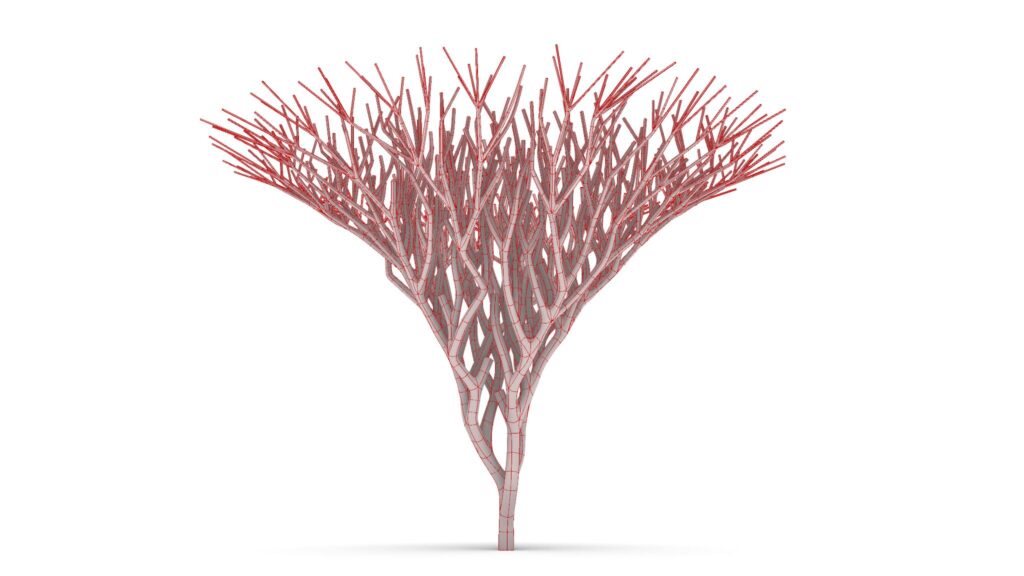
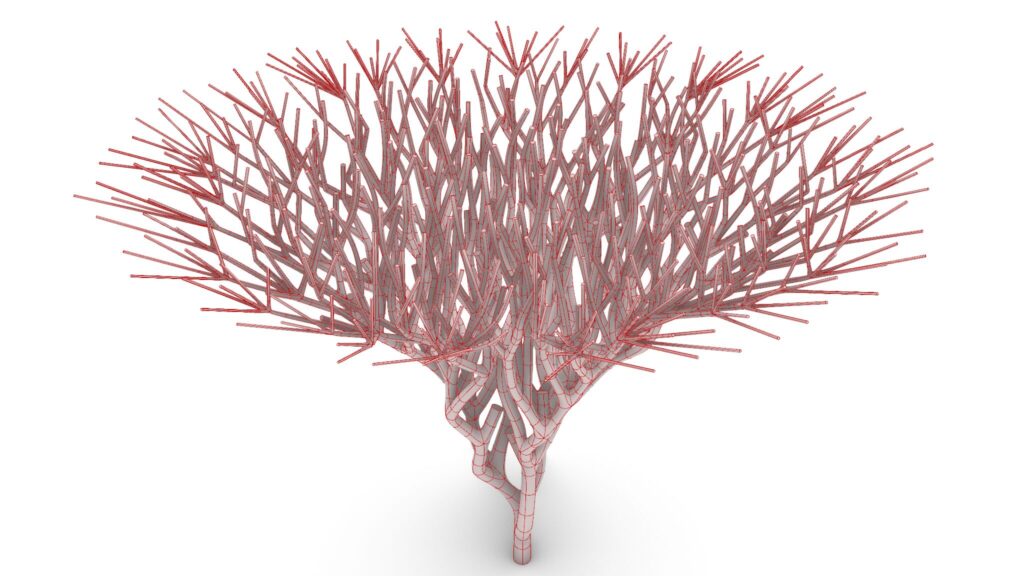
The top two images are from Grasshopper.
The top two images show the model exported on Rhinoceros.
Click here to download the Grasshopper file
Please refer to the Terms of Use regarding the use of downloadable data.
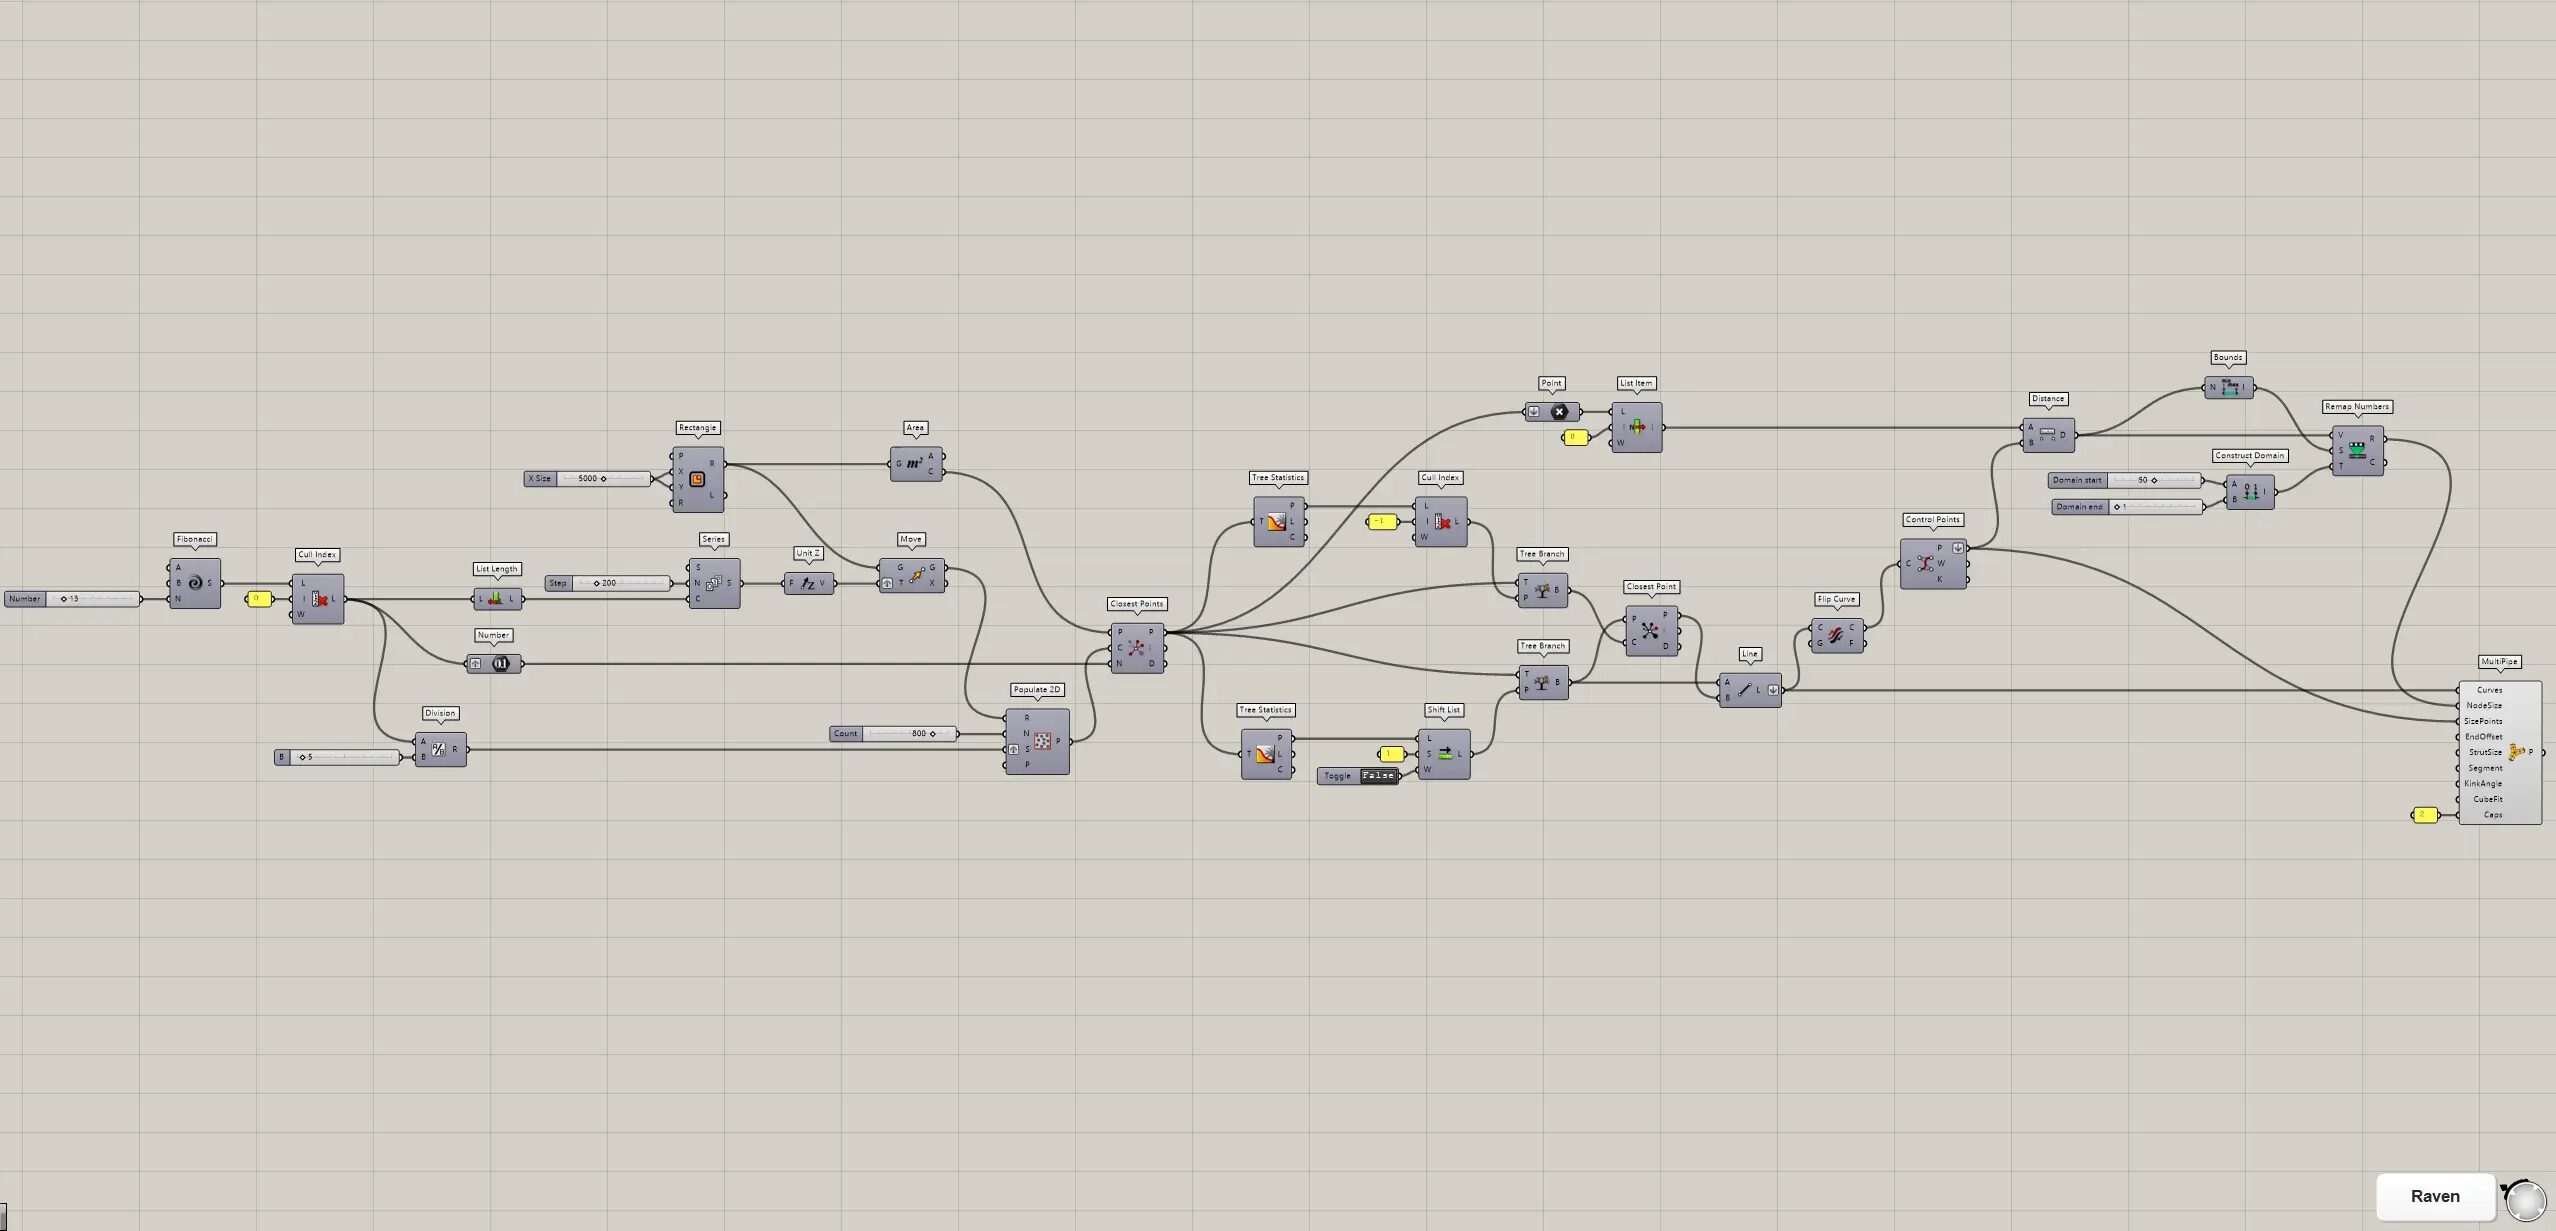
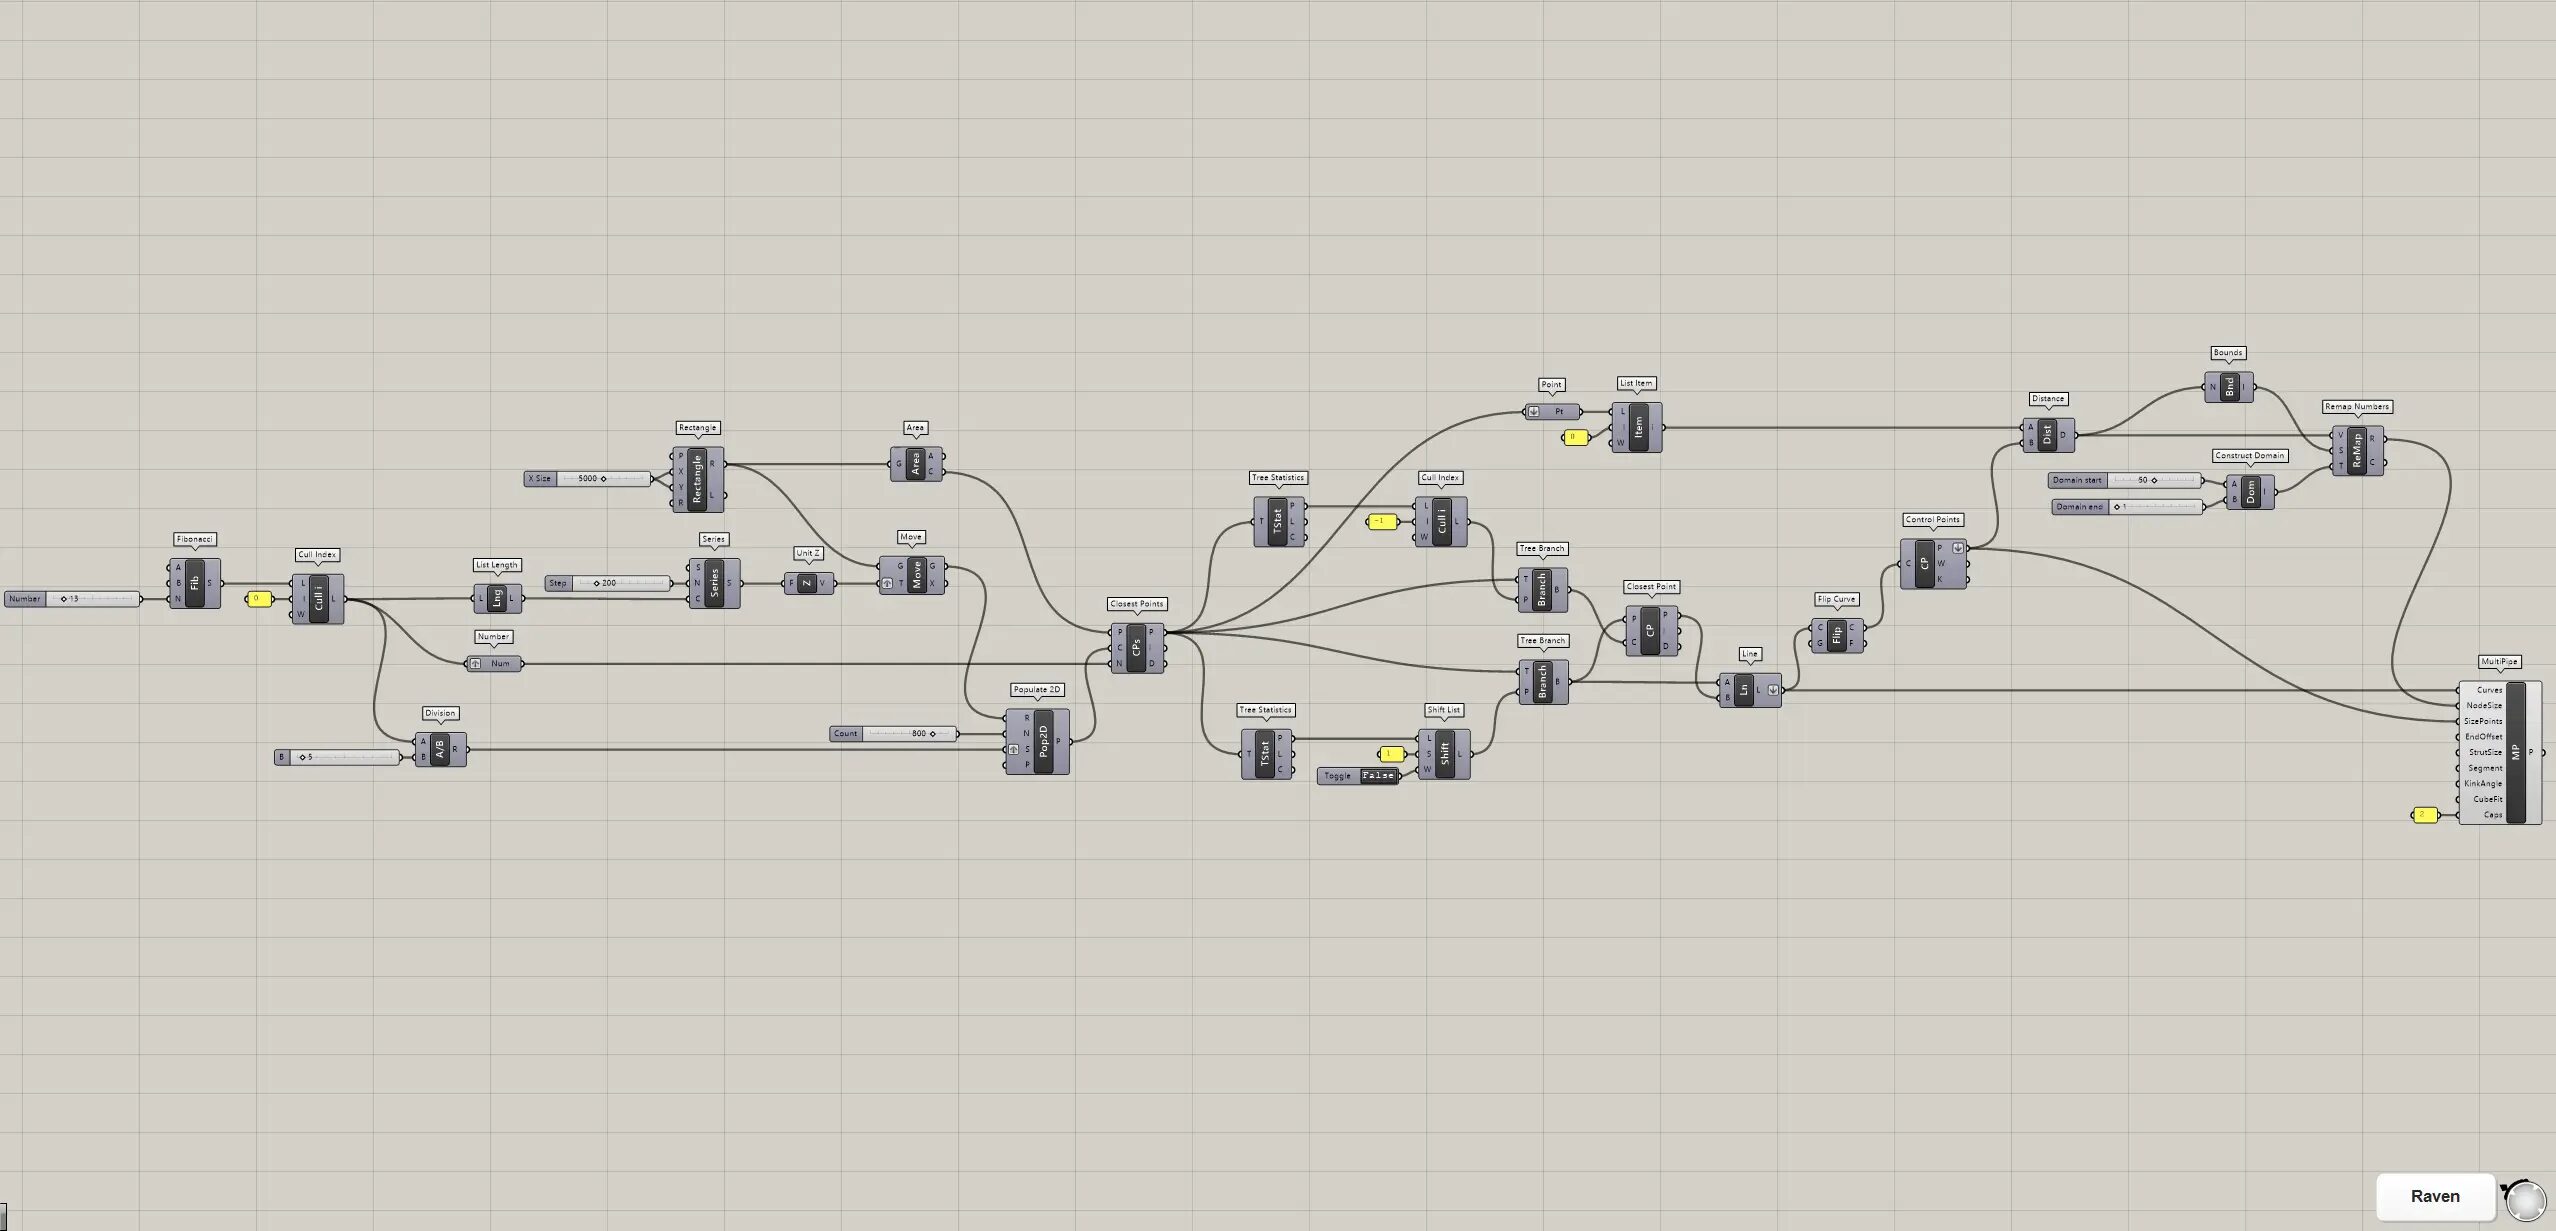
Grasshopper recipe
①Fibonacci ②Cull Index ③List Length ④Number ⑤Division ⑥Series ⑦Unit Z ⑧Rectangle ⑨Move ⑩Area ⑪Populate 2D ⑫Closest Points ⑬Tree Statistics ⑭Boolean Toggle ⑮Shift List ⑯Tree Branch ⑰Closest Point ⑱Line ⑲Flip Curve ⑳Control Points ㉑Point ㉒List Item ㉓Distance ㉔Bounds ㉕Construct Domain ㉖Remap Numbers ㉗MultiPipe
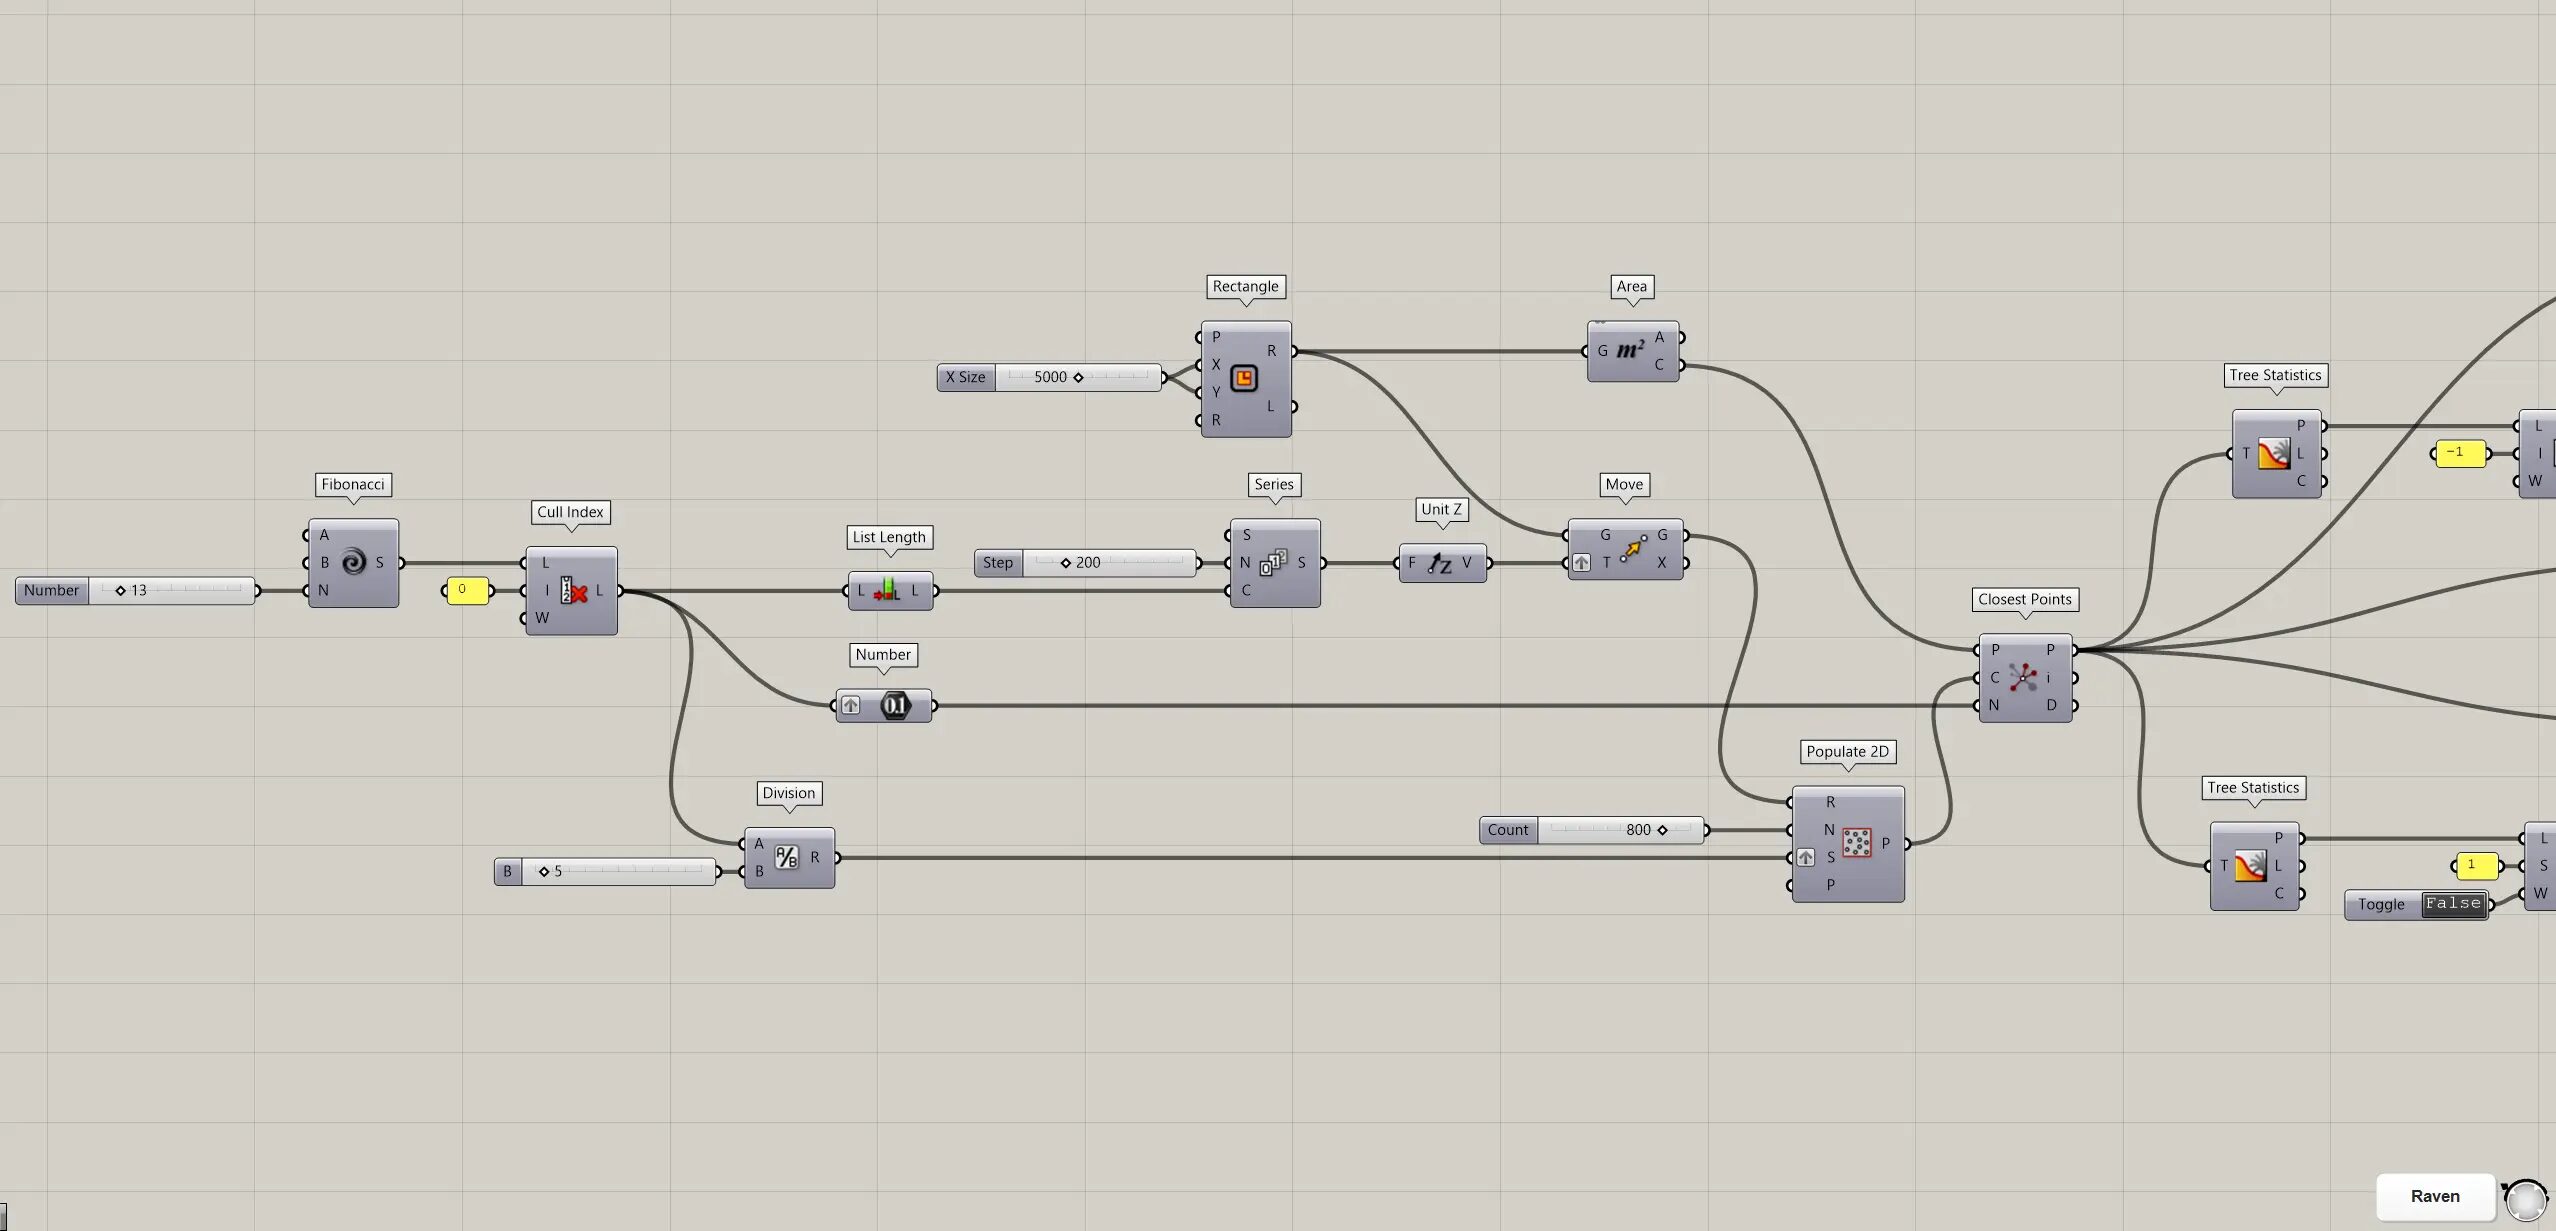
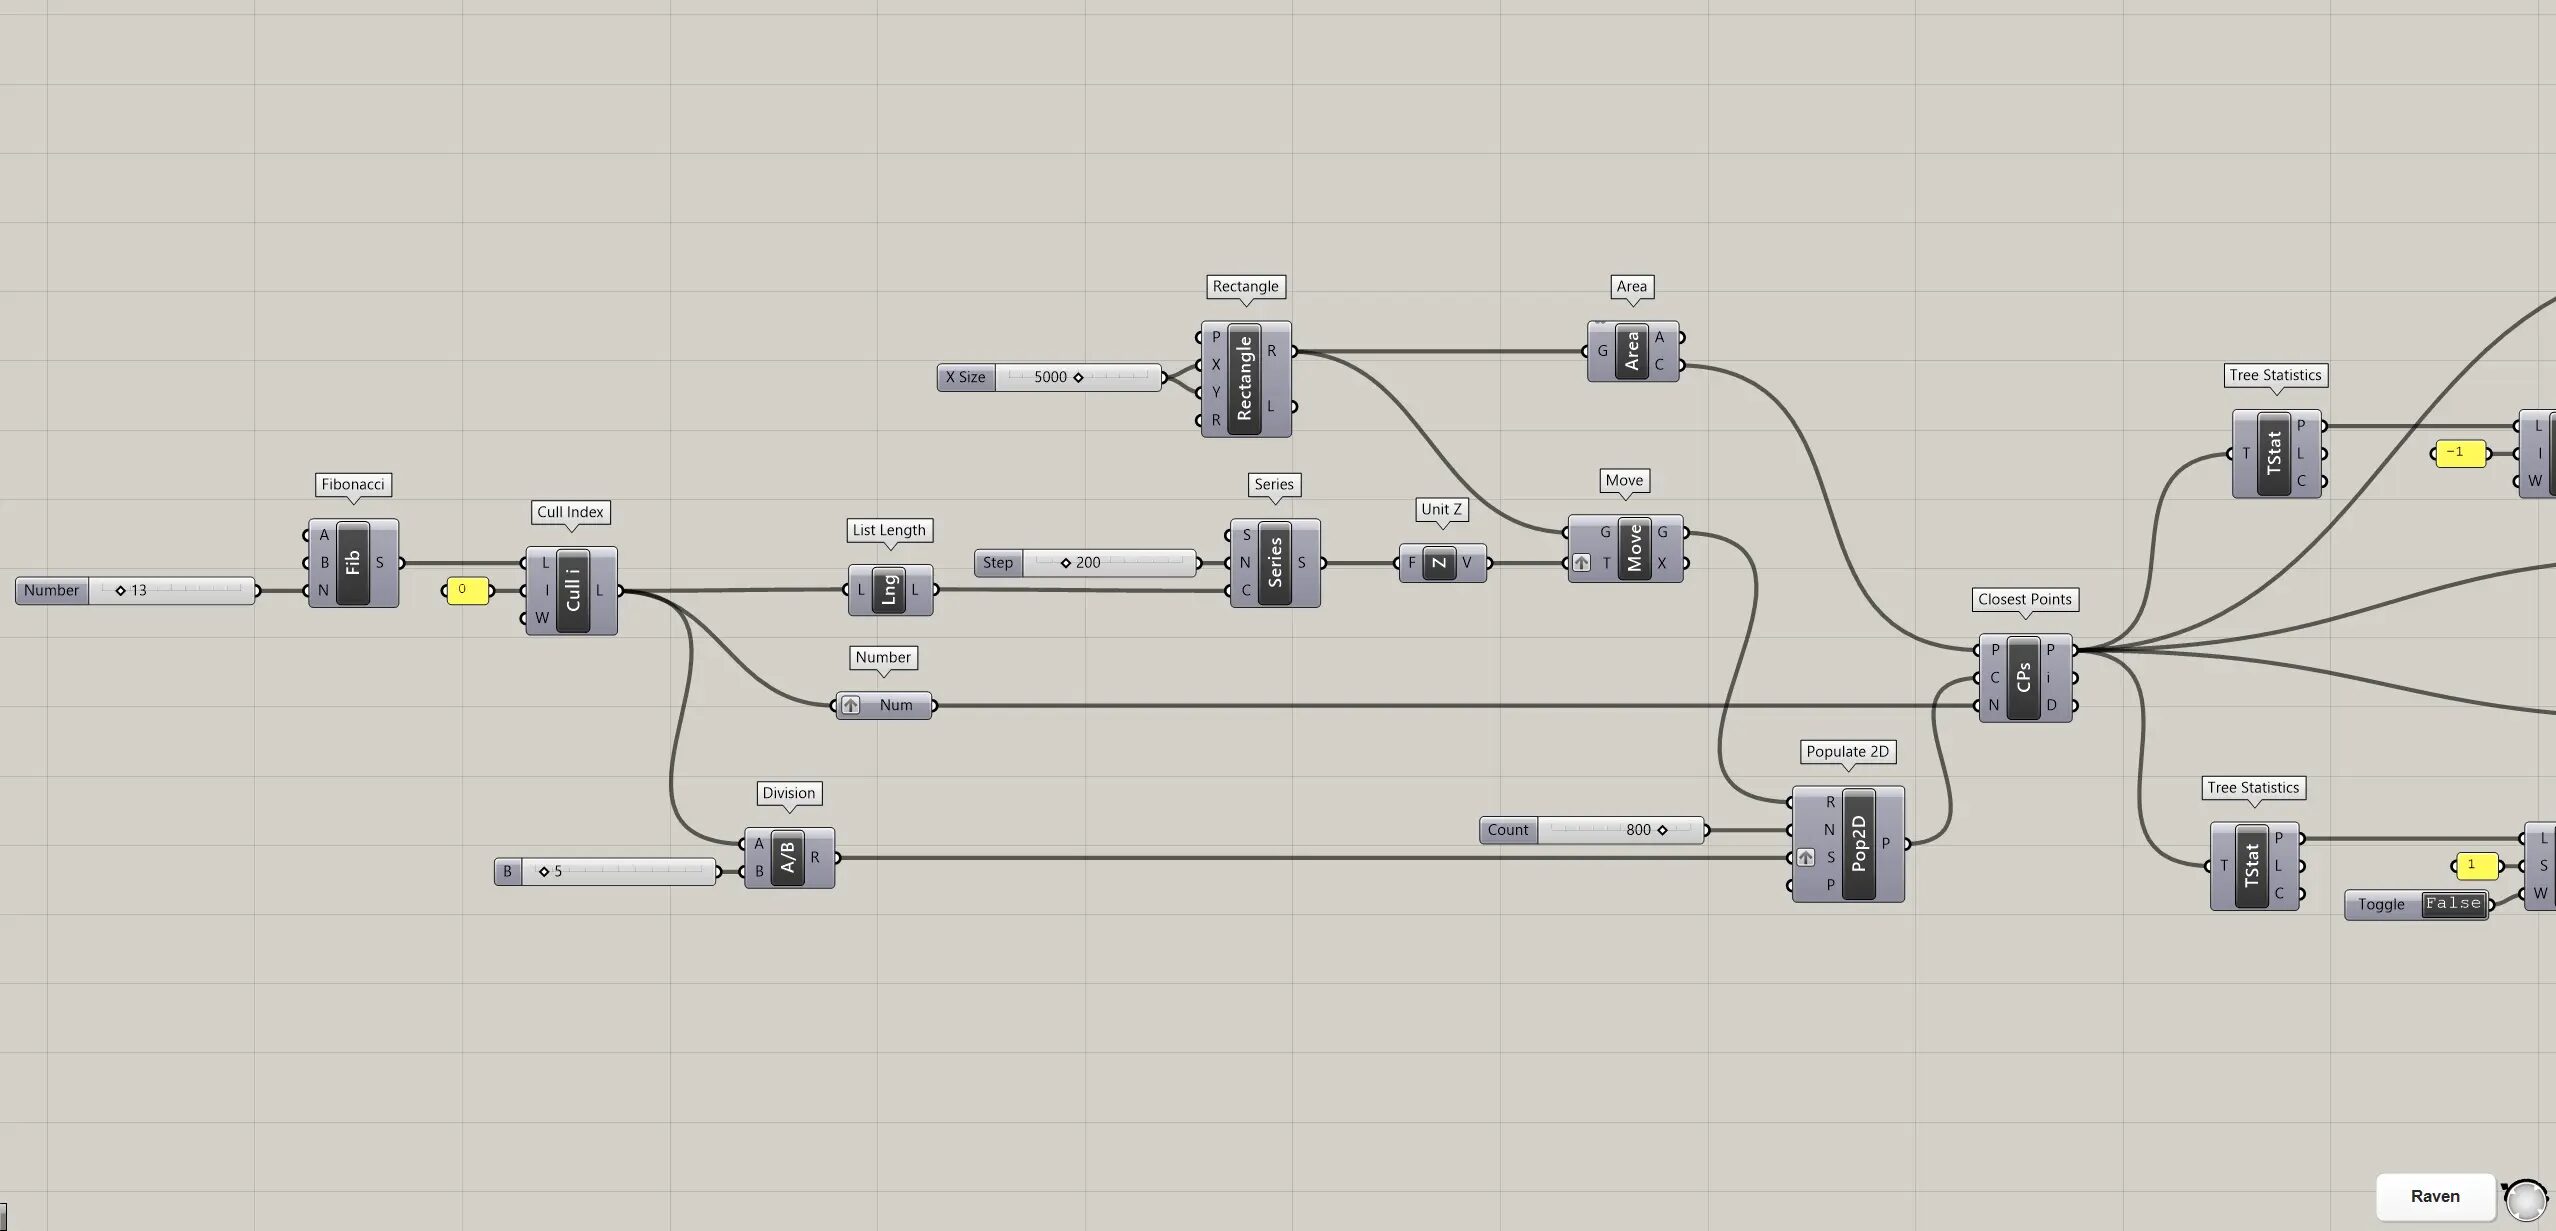
Create random points within multiple quadrangles
First, we will create random points within multiple quadrilaterals.
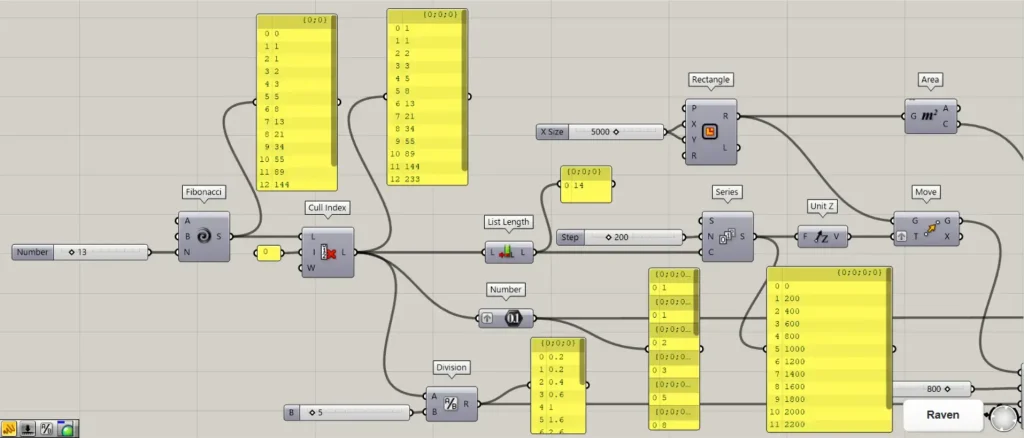
First, we will create the Fibonacci sequence, a number sequence that exists in nature.
Using the numerical values of this sequence, we can create branches.
In a Fibonacci(N), enter the number of items in a sequence.
This time, 13 is entered.
Then 13 numbers will be created as shown in the image above, adding the previous numbers like 0,1,1,2,3,5.
Then connect the Fibonacci to a Cull Index(L).
In addition, connect 0 to the Cull Index(I).
Then you can remove the first 0 number.
Then connect the Cull Index to a List length.
Then the number of data will be output as shown in the image above.
In addition, connect the Cull Index to a Division(A).
Furthermore, connect any number to the Division(B).
This will divide by the number entered in the Division(B).
These numbers will be used later as a seed value to change the randomness.
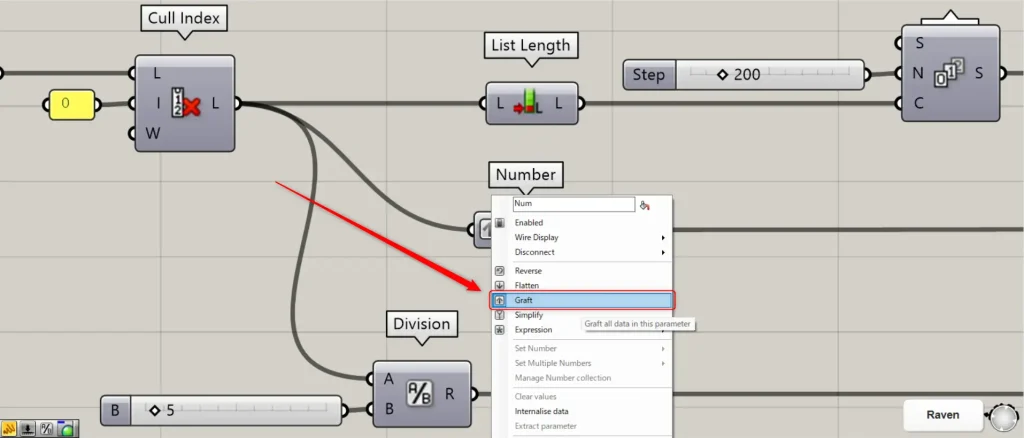
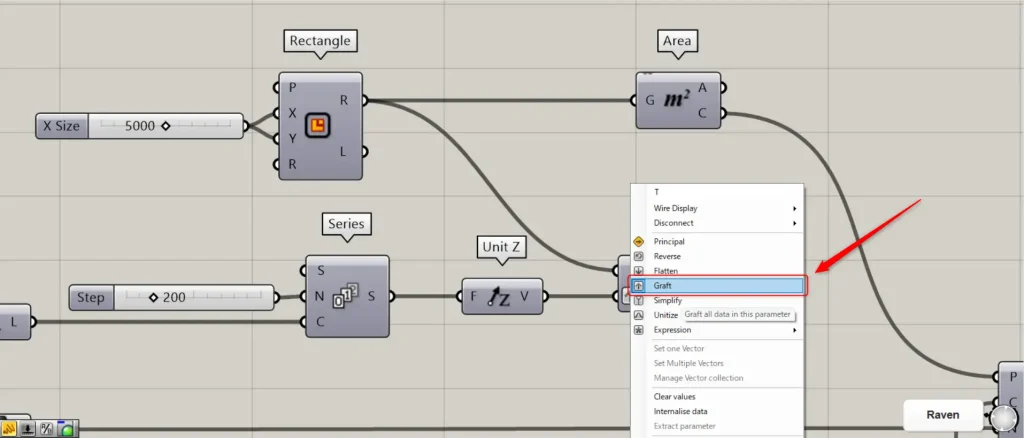
In addition, connect the Cull Index to a Number.
In this case, right click on Number and set it to Graft.
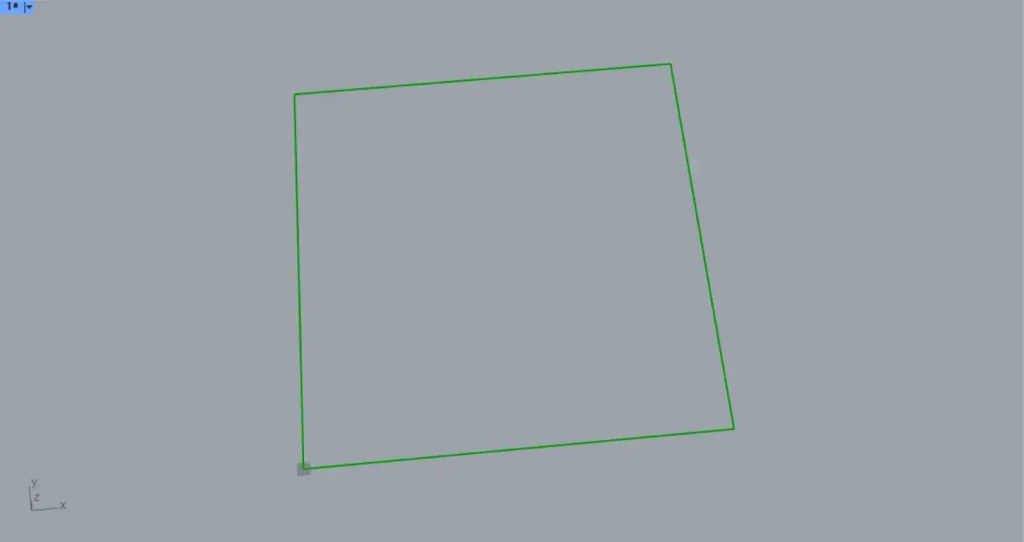
Then enter the lengths of the sides in Rectangle(X)(Y).
This time, 5000 is entered for both.
This will create a 5000 x 5000 square of line data, as shown in the image above.
Then connect the List Length to a Series(C).
Furthermore, connect the numerical value of the distance to be moved to the Series(N).
This time, 200 is connected.
Then 14 numbers are created, this time increasing by 200 from 0.
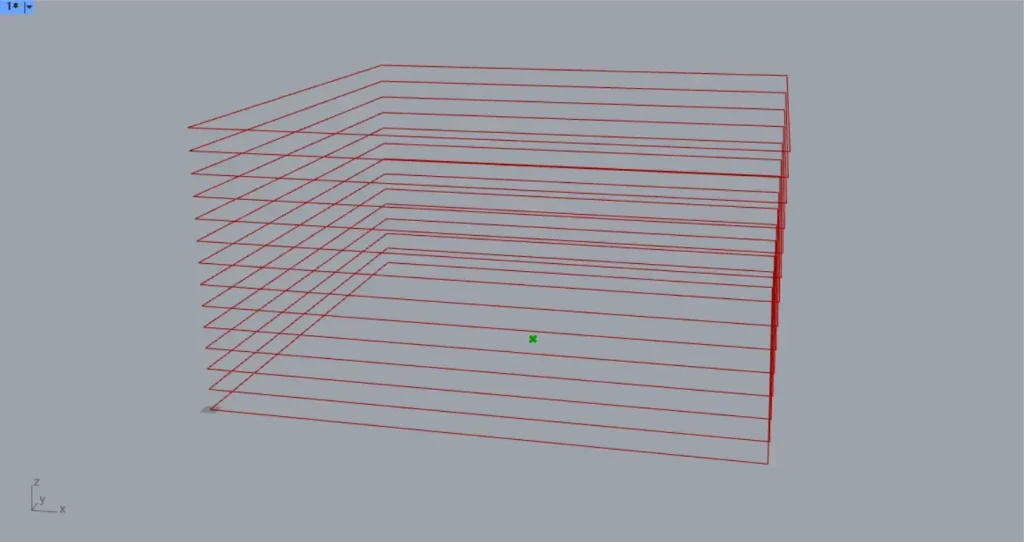
Then connect the Series to an Unit Z.
Then connect the Unit Z to a Move(T).
At this point, right click on the Move(T) and set Graft.
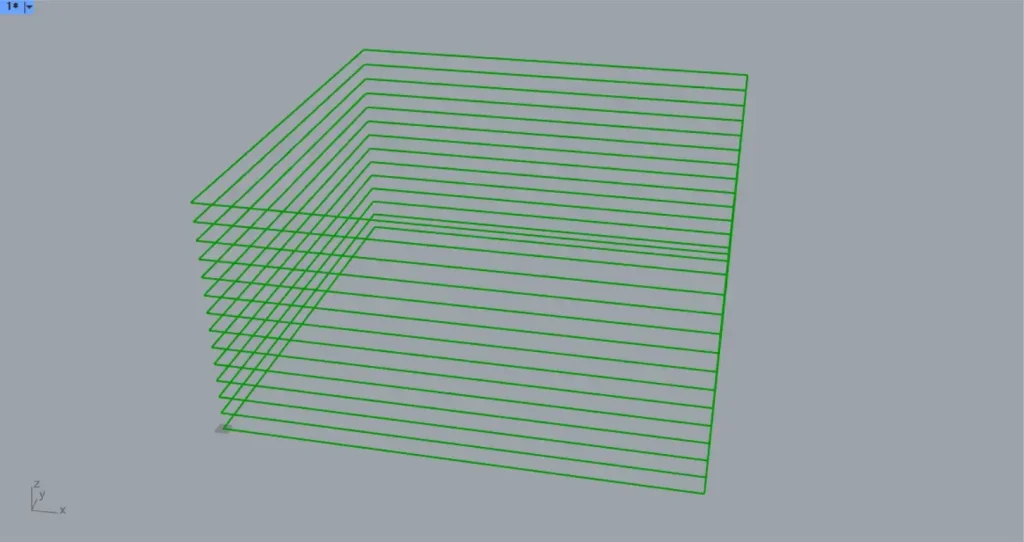
In addition, connect the Rectangle(R) to the Move(G).
This will result in multiple copies of the square directly above, as shown in the image above.
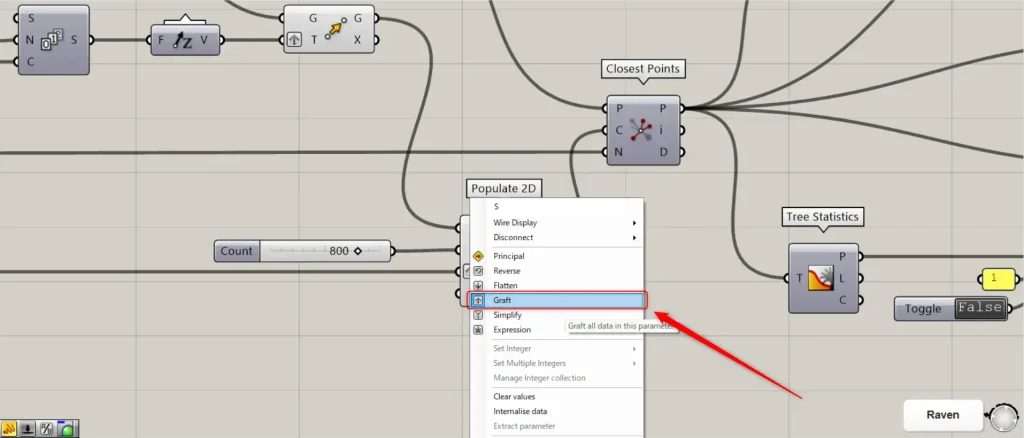
Then connect the Move(G) to a Populate 2D(R).
Furthermore, connect the number of points to the Populate 2D(N).
Furthermore, connect the Division with the created seed value to the Populate 2D(S).
At this point, right click on the Populate 2D(S) and set Graft.
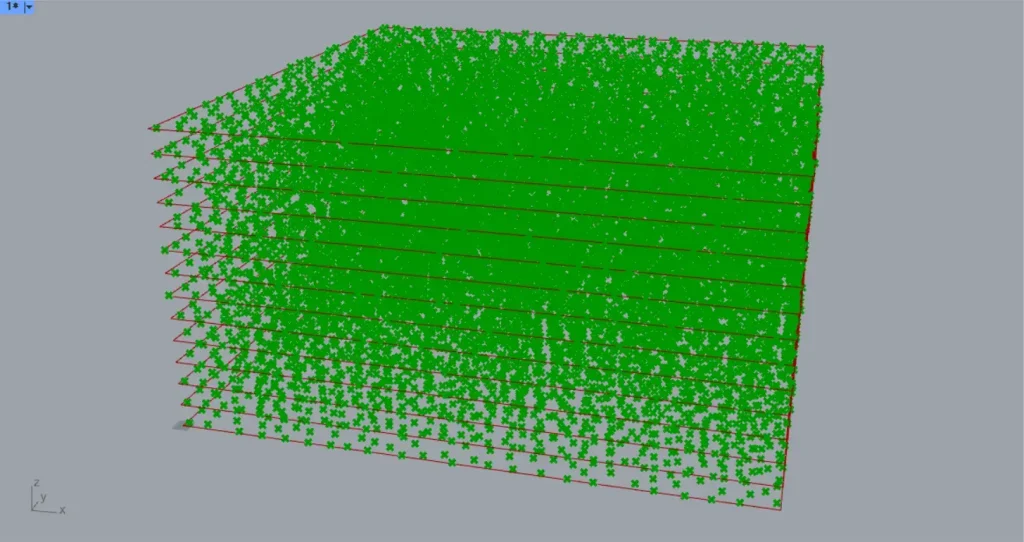
Then random points are created within the squares, as shown in the image above.
Get points and create lines connecting the top and bottom points
Next, we will retrieve points and create lines connecting the top and bottom points.
Connect the Rectangle(R) to an Area.
Then you can get the center point of the bottom square, as in the image above.
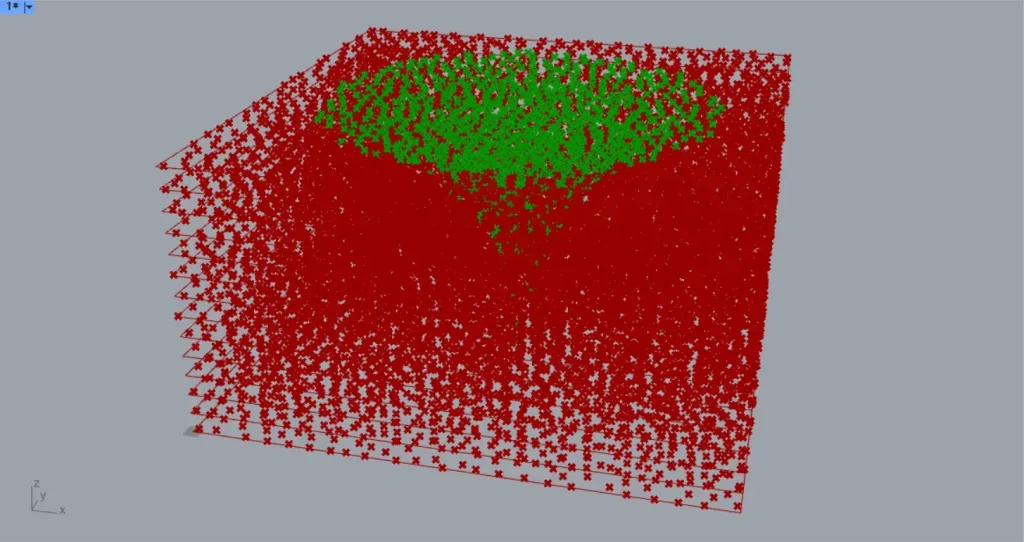
Then connect the Area(C) to a Closest Points(P).
In addition, connect the Populate 2D(P) to the Closest Points(C).
Furthermore, connect the Number from earlier to the Closest Points(N).
Then you can get the points inside each rectangle according to the Fibonacci sequence, as shown in the two images above.
The Closest Points(P) are then connected to the two Tree Statistics.
This allows us to get the branch of the data.
Then connect the first Tree Statistics(P) to a Cull Index(L).
In addition, connect -1 to the Cull Index(I).
This allows us to remove the last level of the branch.
Then connect the second Tree Statistics(P) to a Shift List(L).
In addition, connect 1 to the Shift List(S).
Furthermore, connect the false information to the Shift List(W).
This time, a Boolean Toggle is used to create false information.
This allowed us to shift the branch data one by one.
Then the Cull Index and the Shift List are connected to a Tree Branch(T).
Furthermore, we connect the Closest Points(P) to the two Tree Branch(P).
This allows you to retrieve only point data for given branches.
Then connect the first Tree Branch to a Closest Point(C).
In addition, connect the second Tree Branch to the Closest Point(P).
Then you can get the nearest points below from the points above.
Then connect the second Tree Branch to a Line(A).
Furthermore, connect the Closest Point(P) to the Line(B).
Then lines will be created connecting the top and bottom points, as shown in the image above.
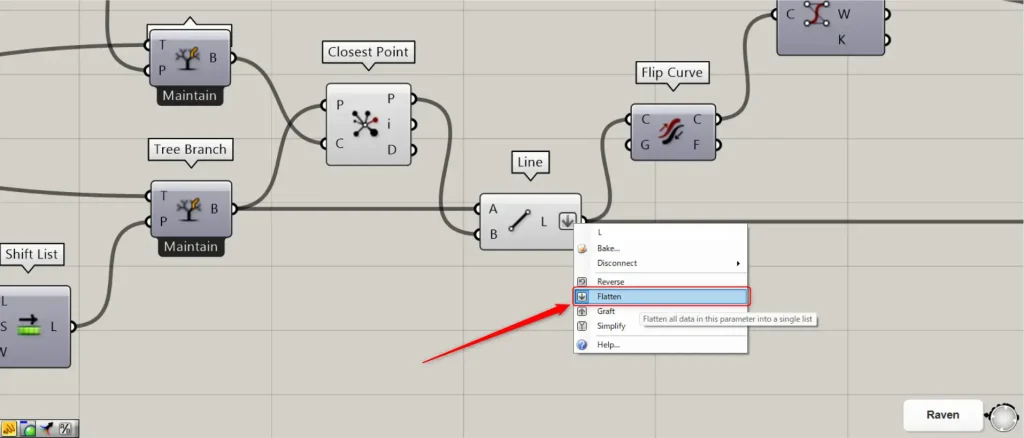
At this point, right click on the Line(L) and set Flatten.
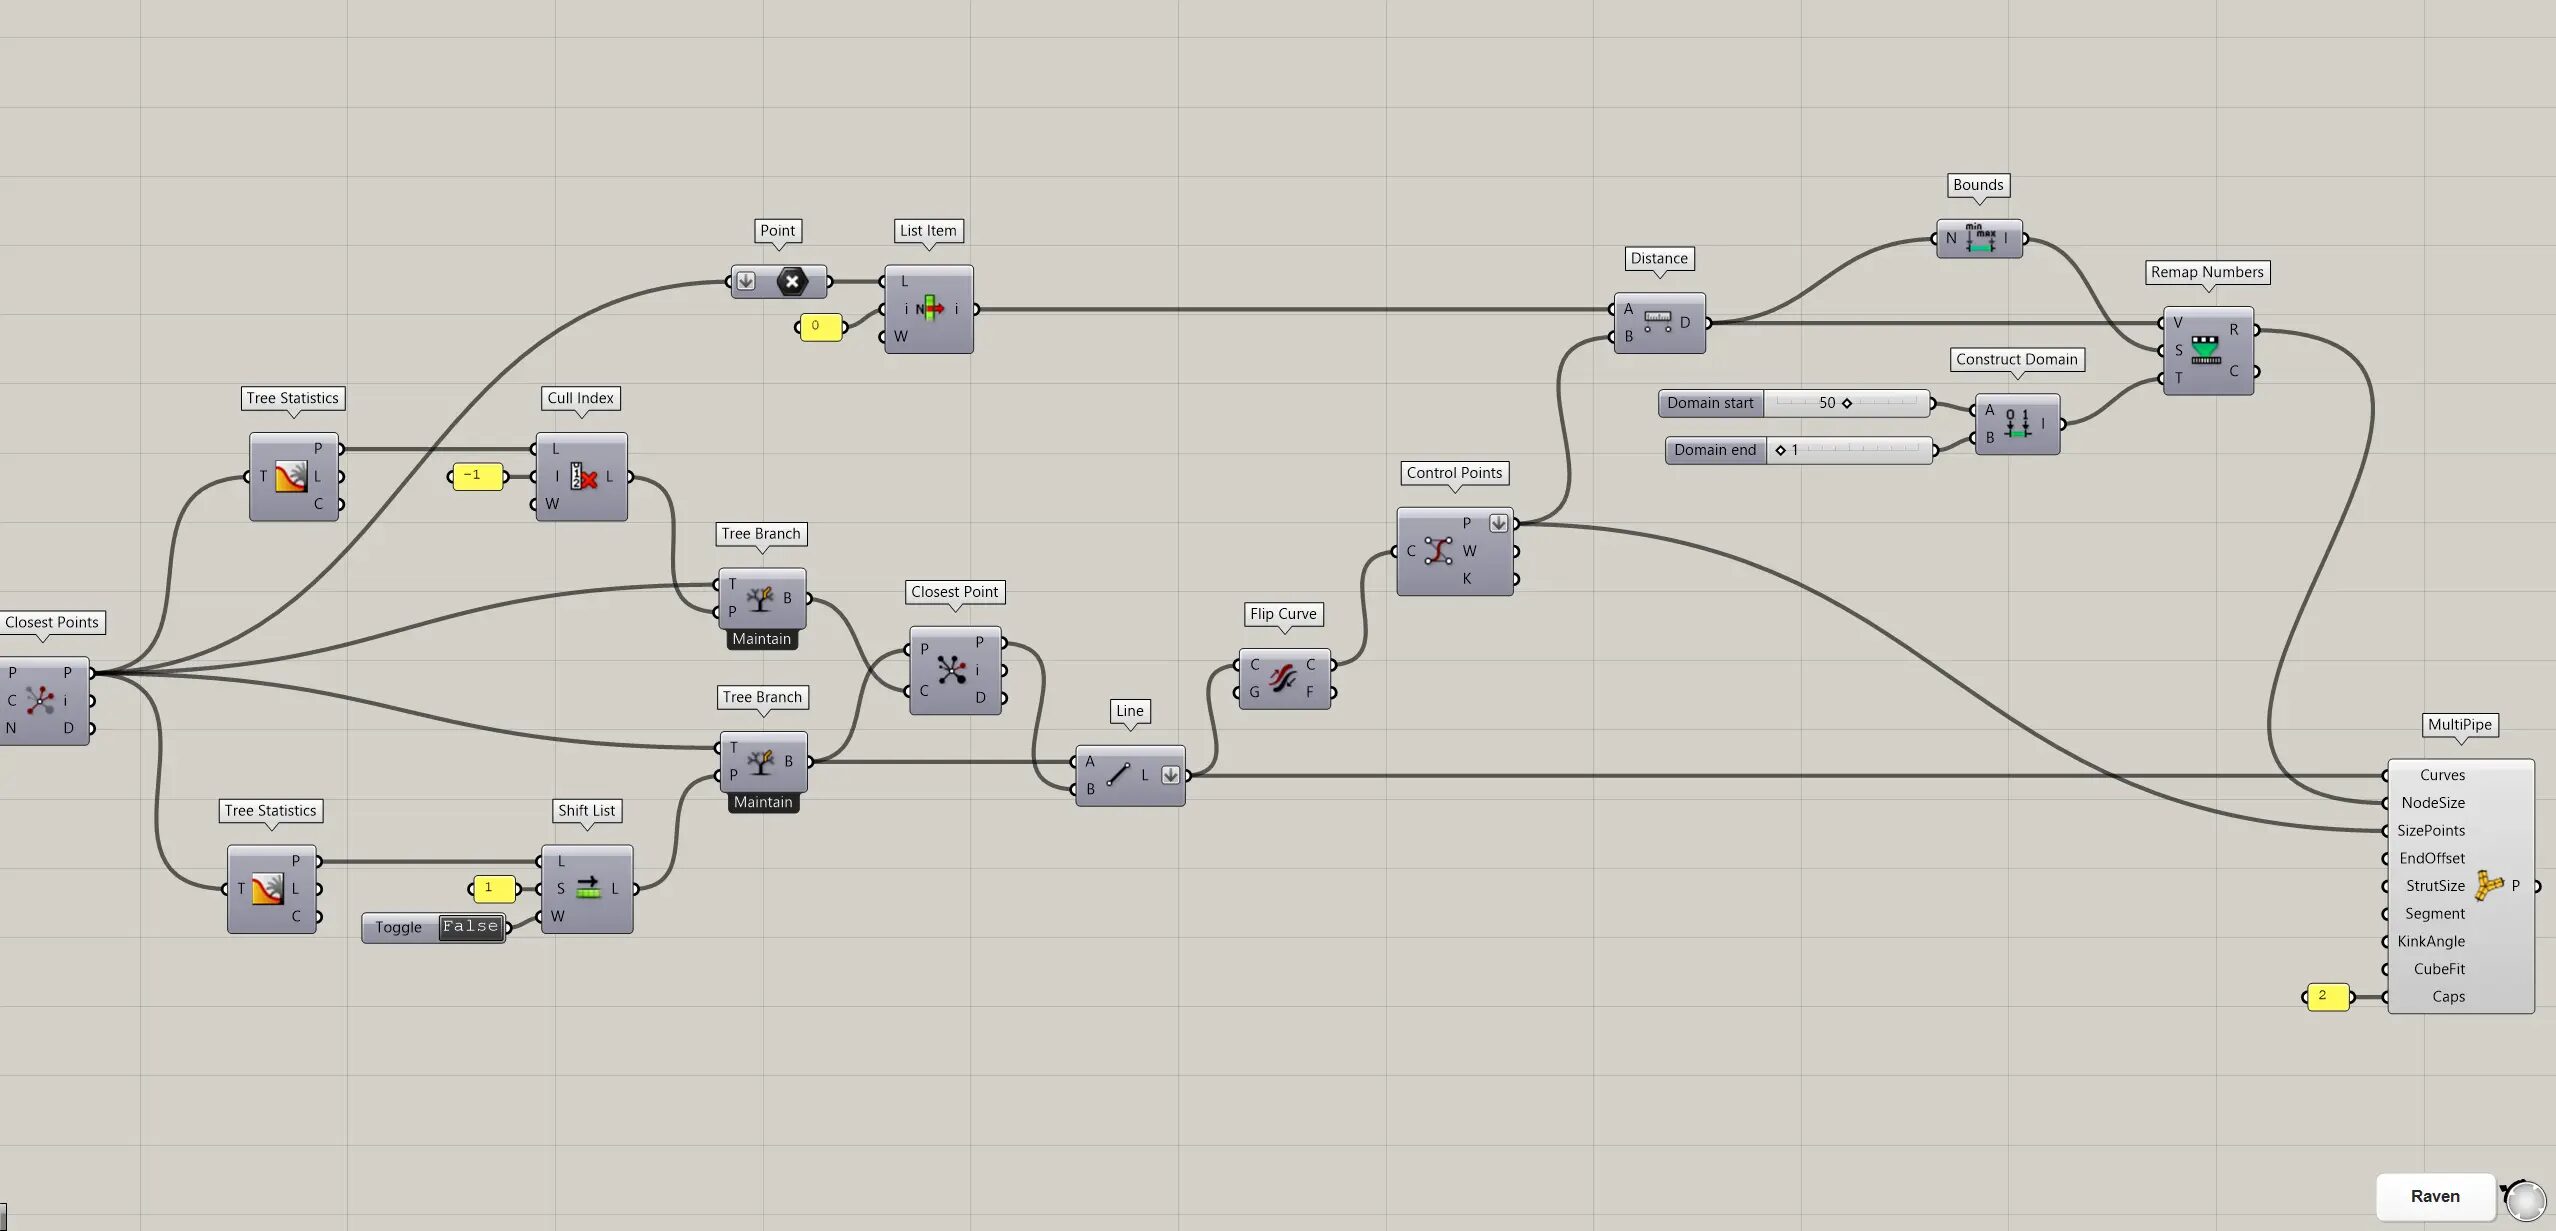
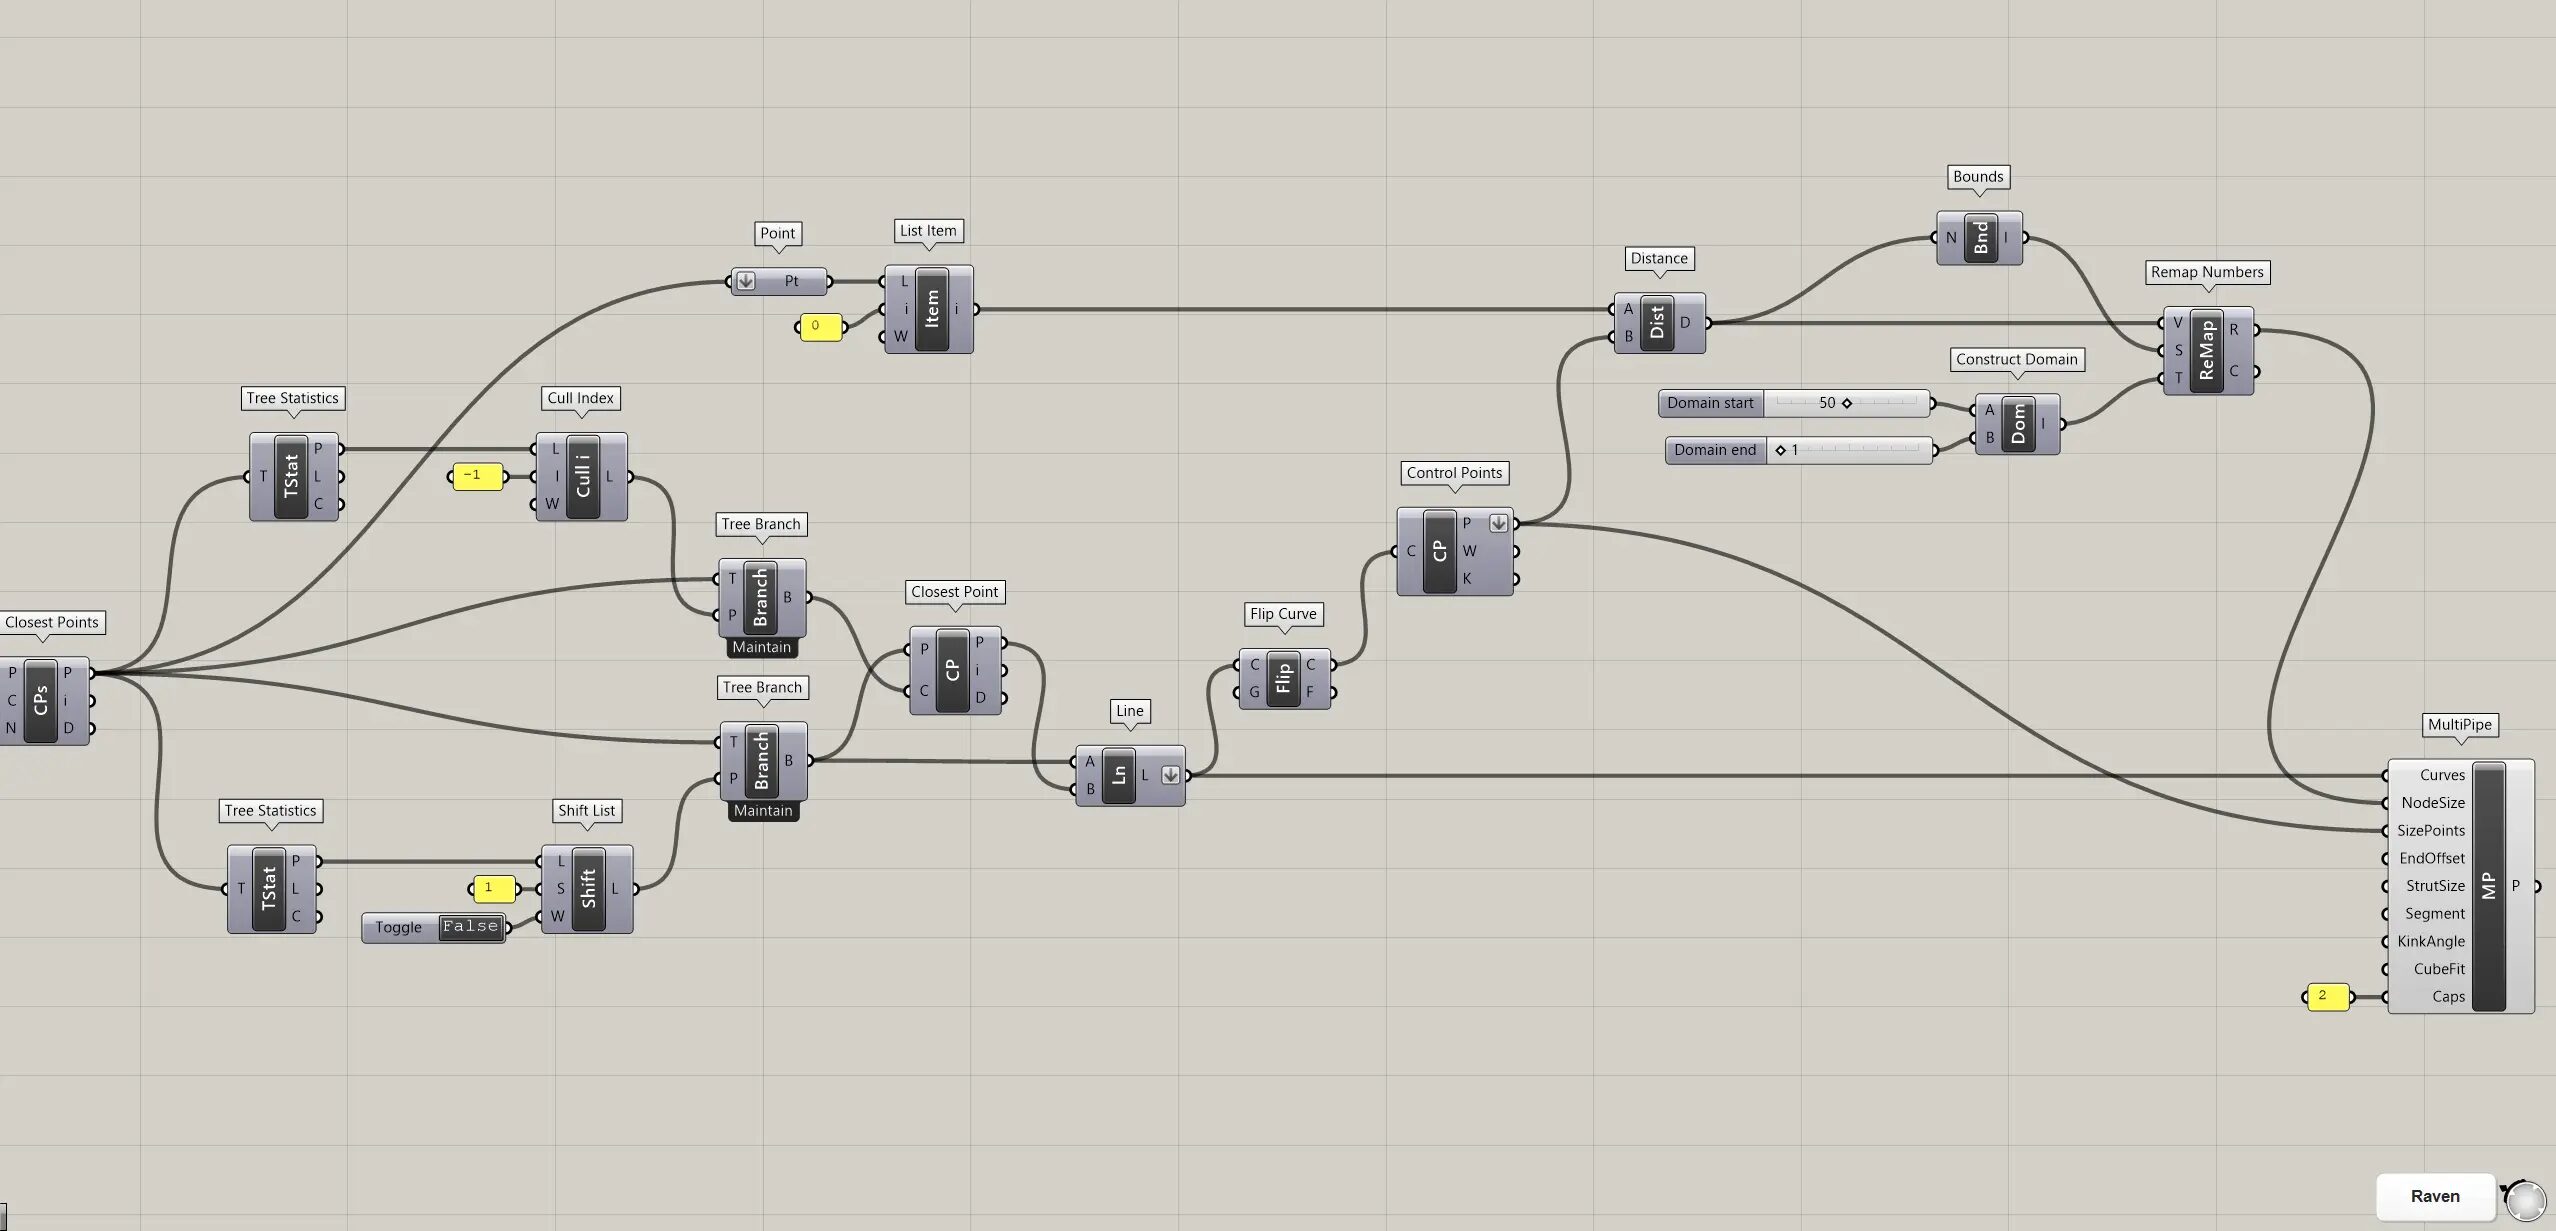
Give the lines thickness
Finally, we will add thickness to the lines.
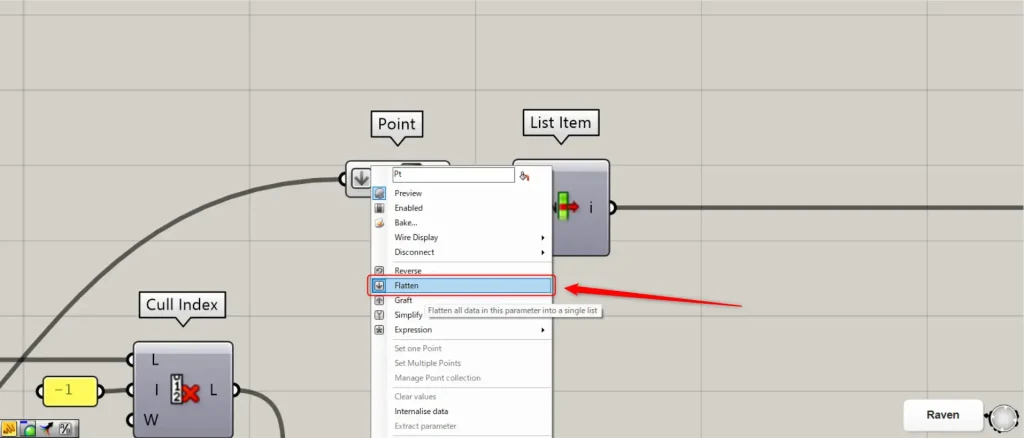
Connect the Closest Points(P) to a Point.
At this point, right click on the Point and set Flatten.
Then connect the Point to a List Item(L).
In addition, connect 0 to the List Item(i).
Then you can get the bottom point, as in the image above.
Then connect the Line to a Flip Curve(C).
This will reverse the direction of the lines.
Then connect the Flip Curve(C) to a Control Points.
Then you can get the control points for each line, as shown in the image above.
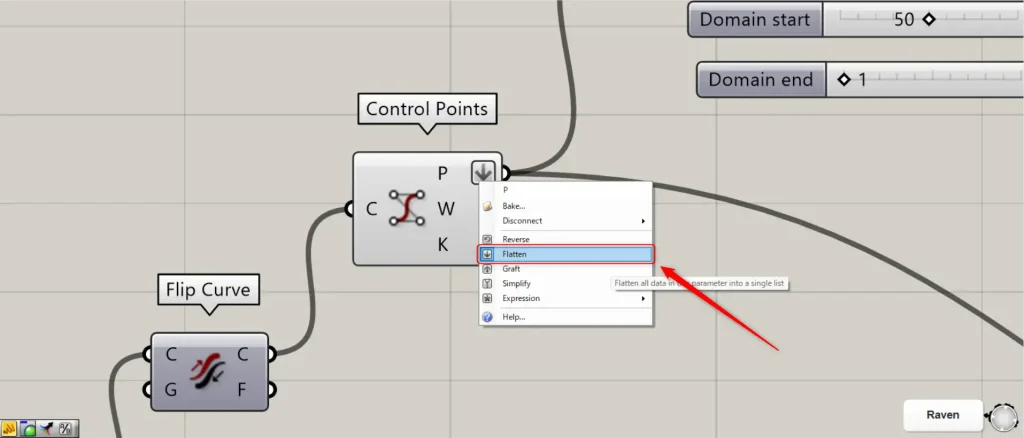
At this point, right click on the Control Points(P) and set it to Flatten.
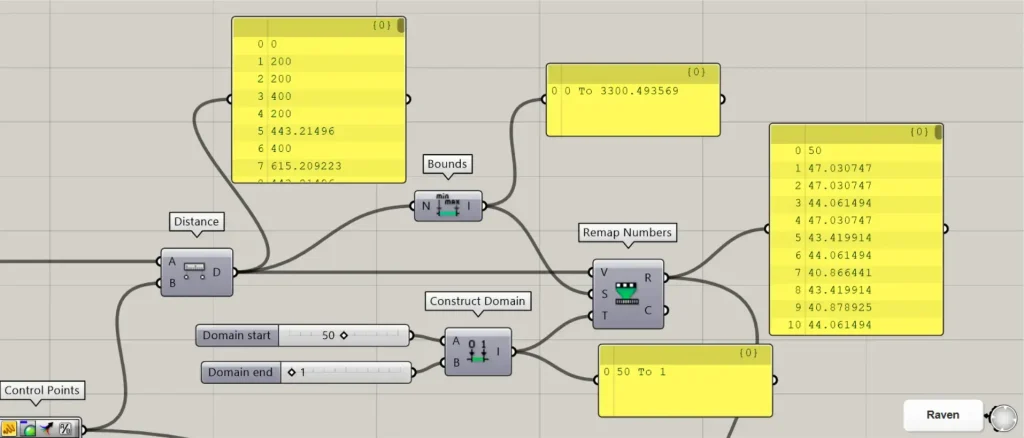
Then connect the List Item to a Distance(A).
In addition, connect the Control Points(P) to the Distance(B).
Then you can get the distance from the bottom point to each control point.
Then connect the Distance to a Bounds.
Then a numerical range is created that can be made from the minimum and maximum values of the distance obtained.
Then connect the maximum thickness value to a Construct Domain(A).
This time, 50 are connected.
Furthermore, connect the minimum thickness value to the Construct Domain(B).
This time, 1 is connected.
Then a numeric range of 50 To 1 is created.
Then connect the Distance to a Remap Numbers(V).
In addition, connect the Bounds to the Remap Numbers(S).
In addition, connect the Construct Domain to the Remap Numbers(T).
Then the distance values are converted to a range of 0 to 50.
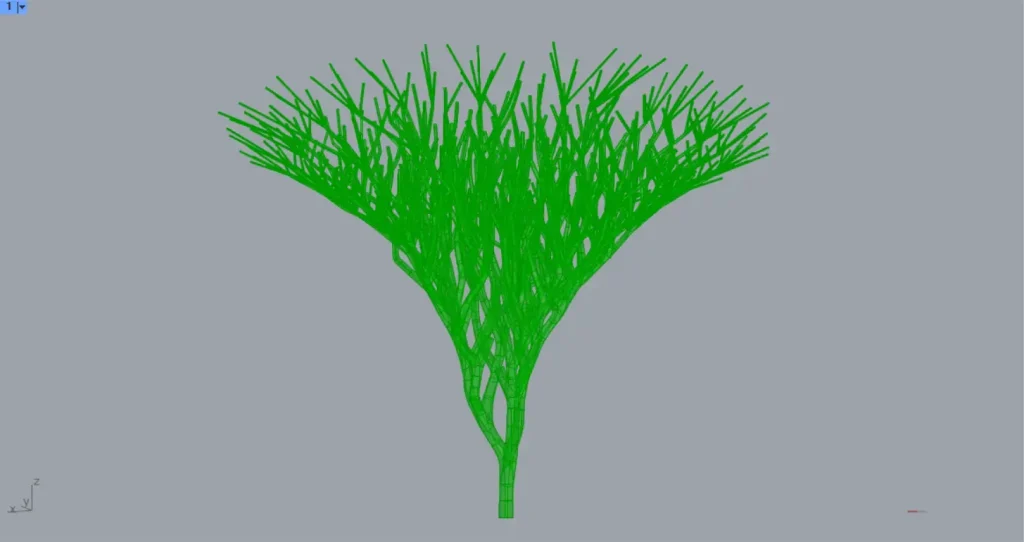
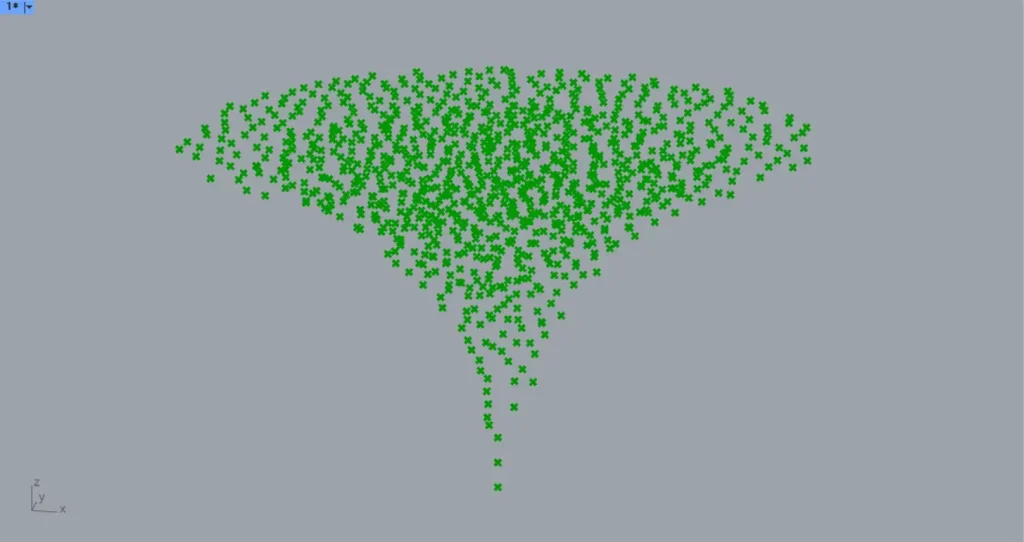
Then connect the Line to a MultiPipe(Curves).
In addition, connect the Remap Numbers(R) to the MultiPipe(NodeSize).
In addition, connect the Control Points(P) to the MultiPipe(SizePoints).
In addition, connect 2 to the MultiPipe(Caps).
Then we have created a trunk and branches that get thinner as it goes up from the ground, as shown in the image above.
That’s all for this time.


Comment