This article describes how to design Pavilion inspired by a spiral shell using Grasshopper.
Video
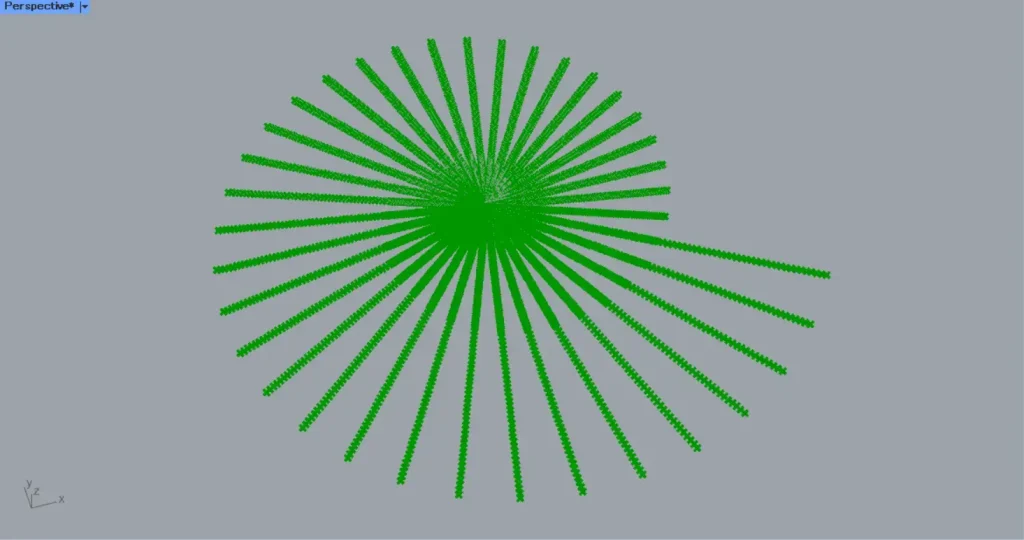
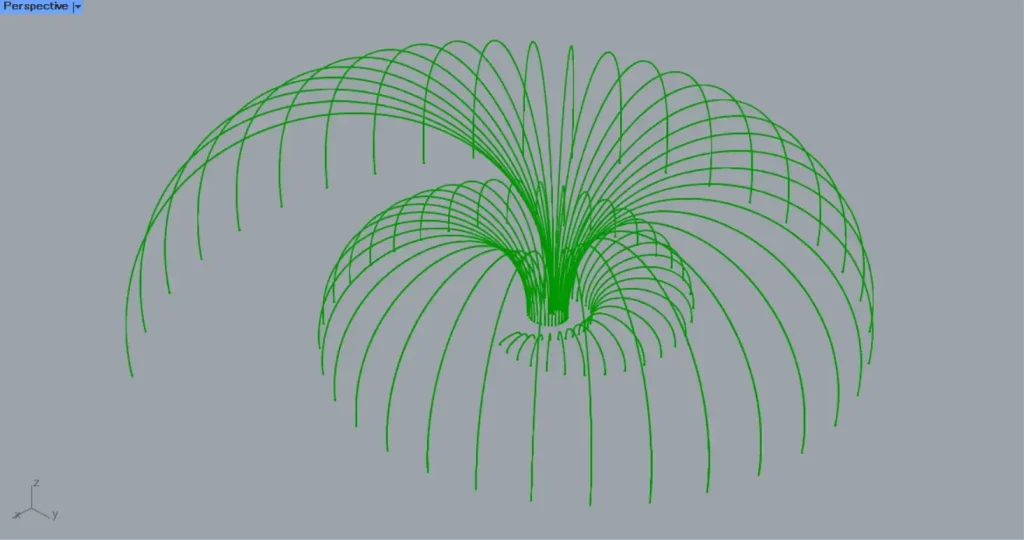
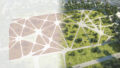
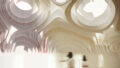
Model Images
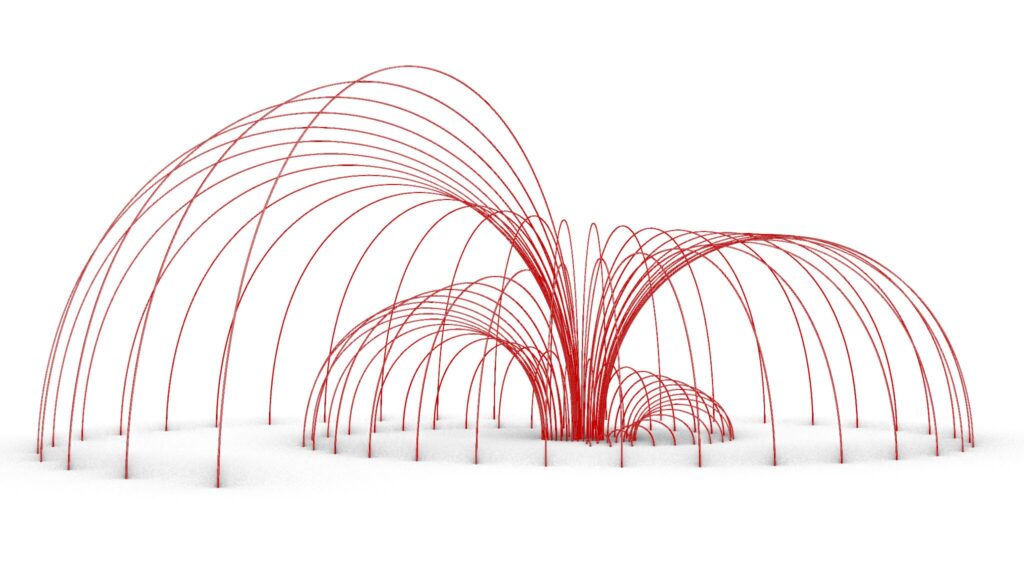
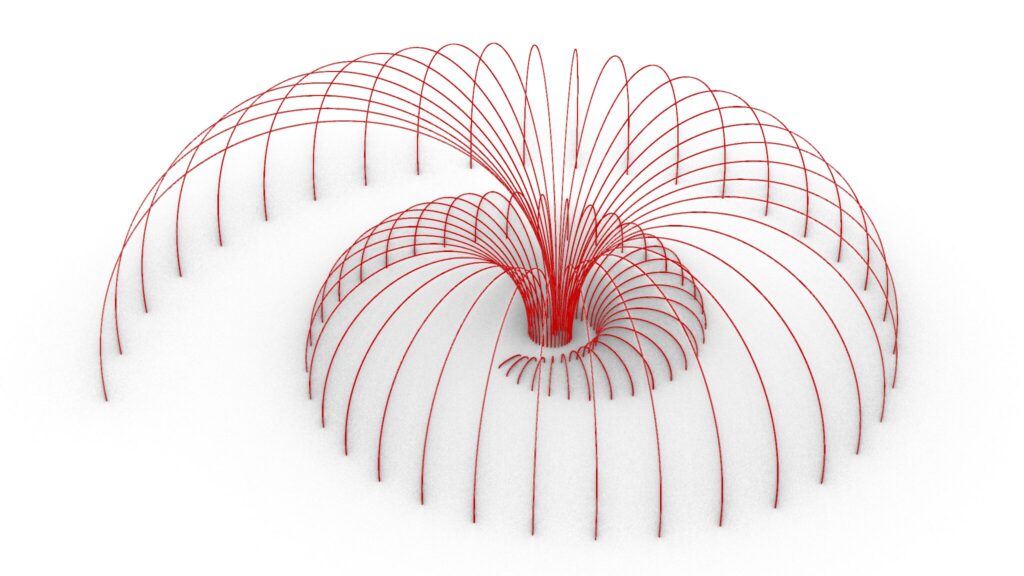
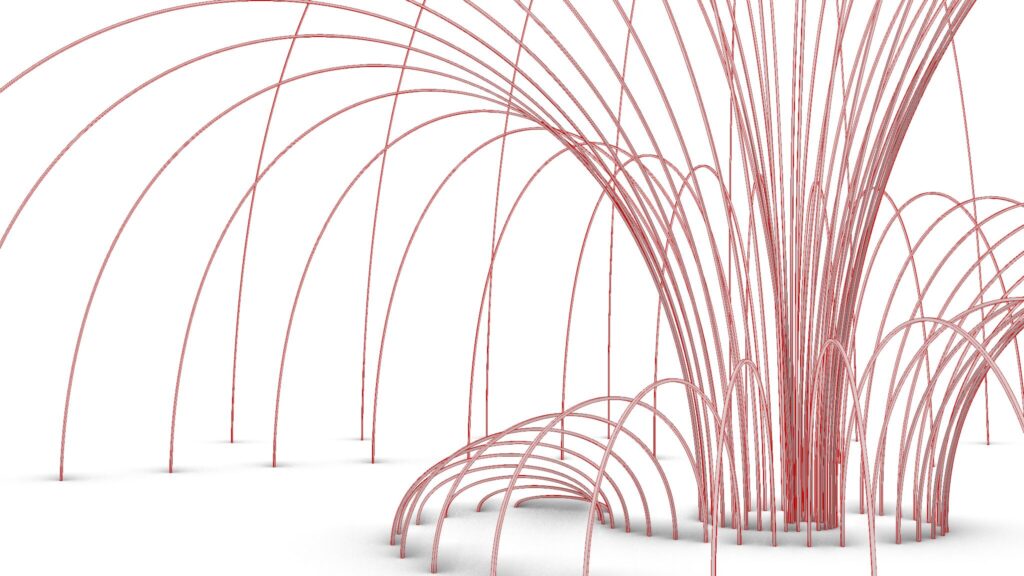
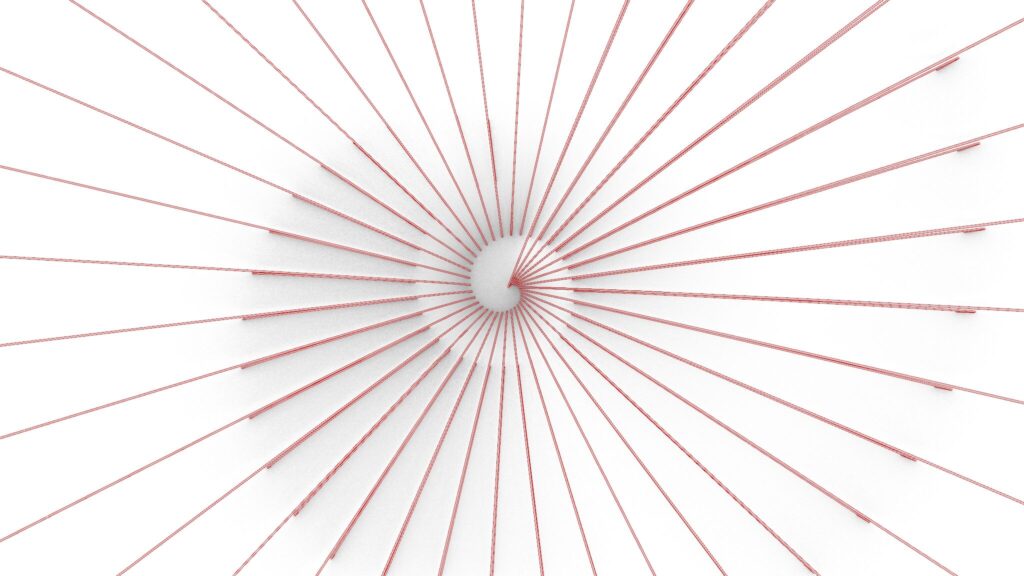
The top four images are from Grasshopper.
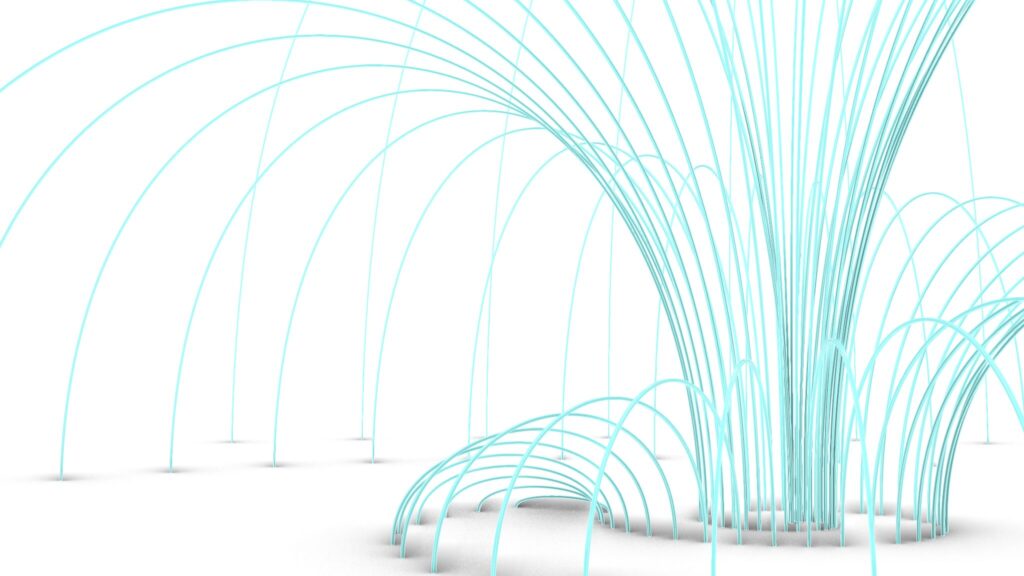
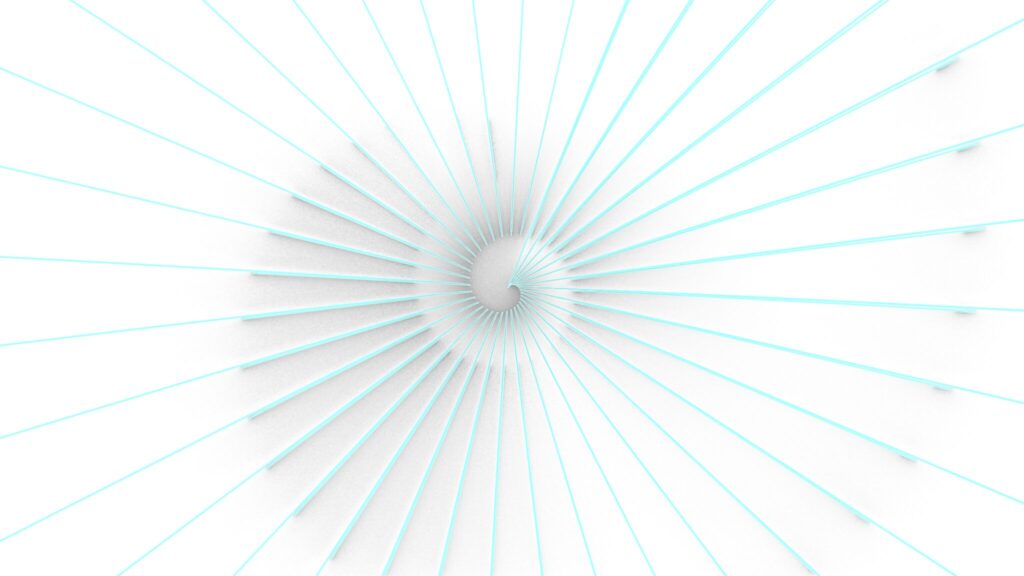
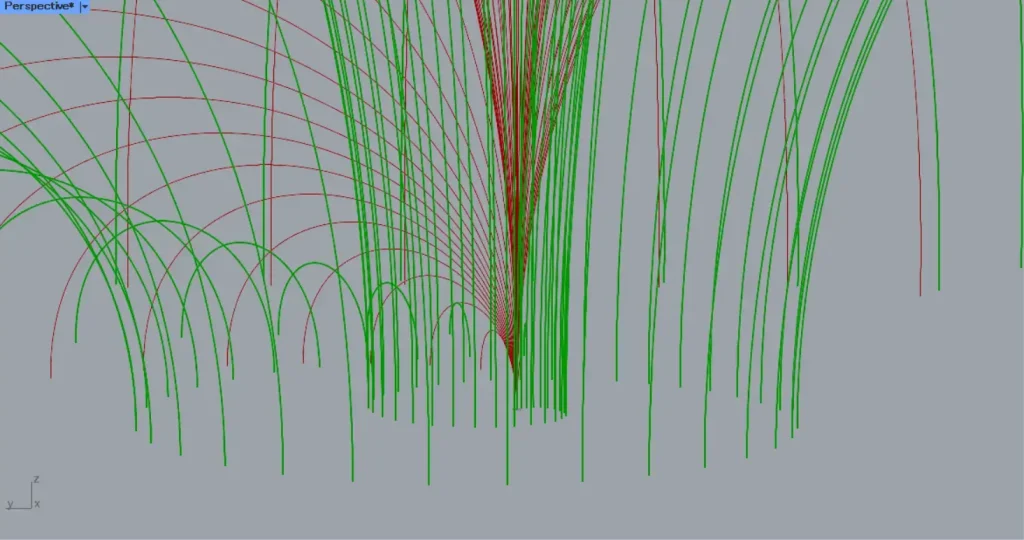
The top four images show the model exported on Rhinoceros.
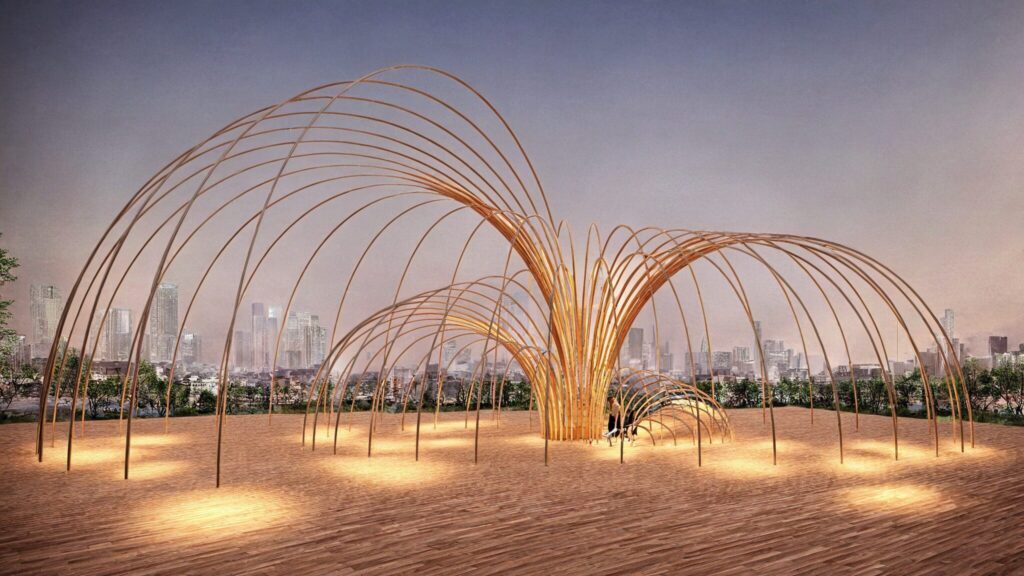
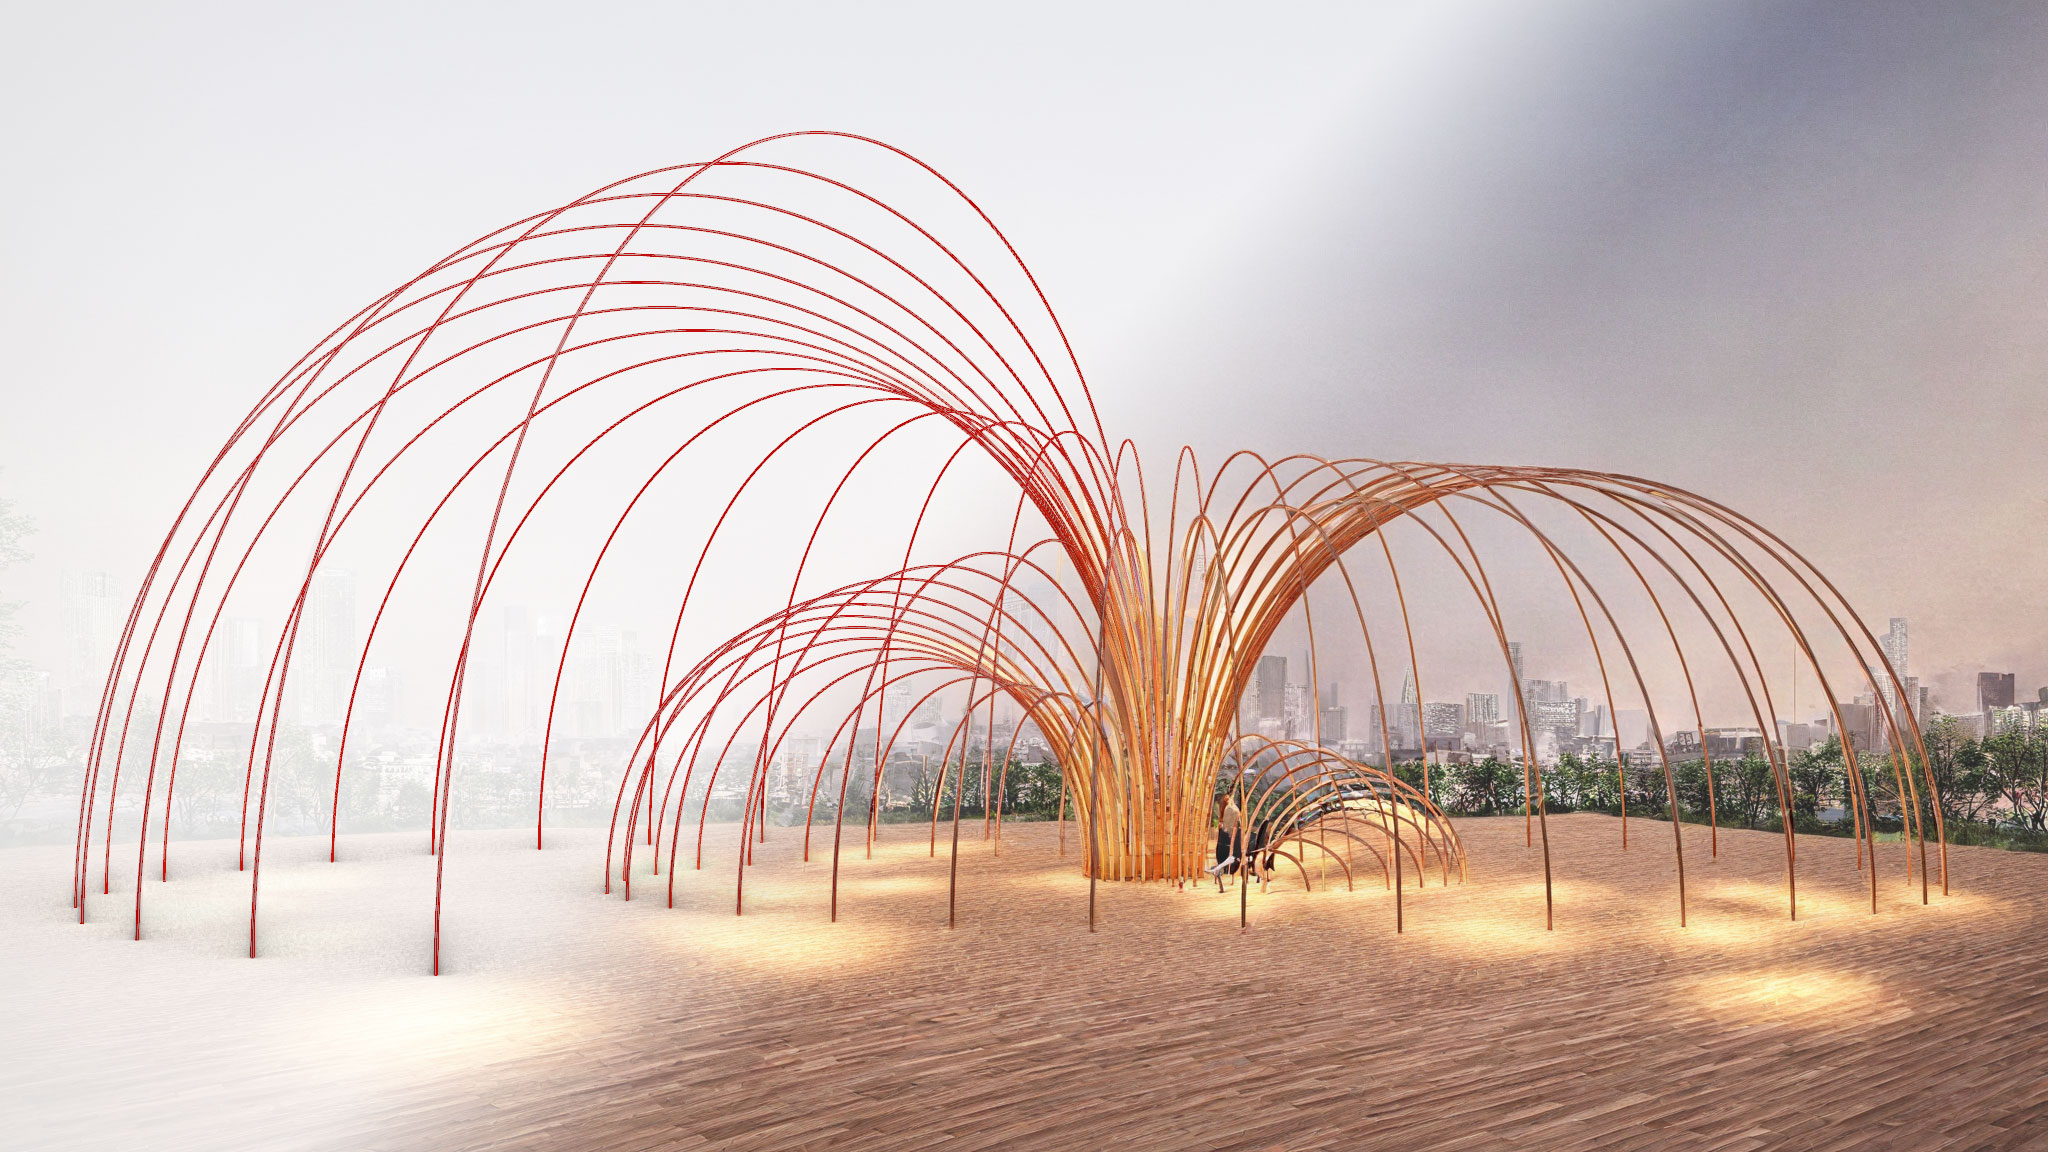
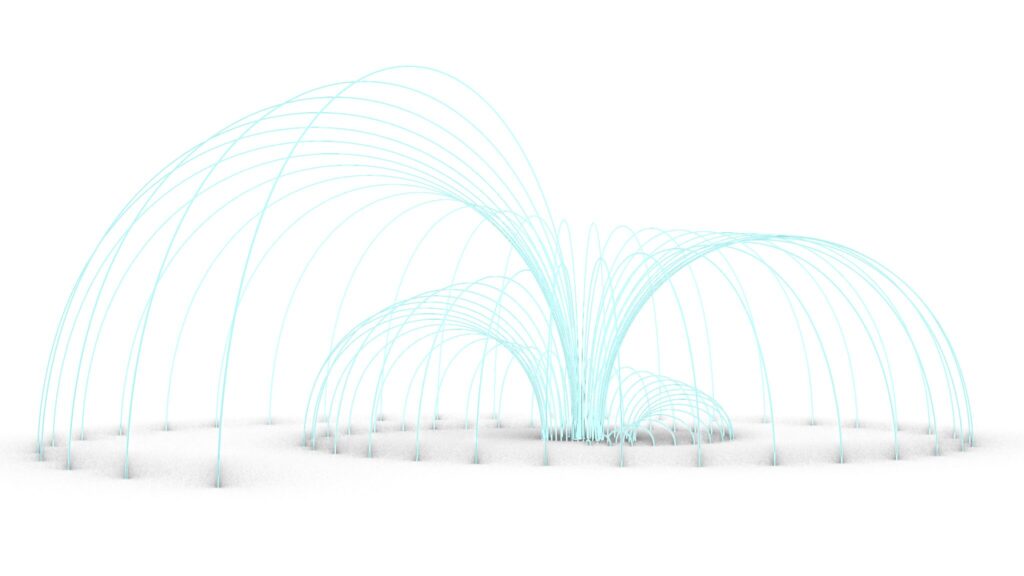
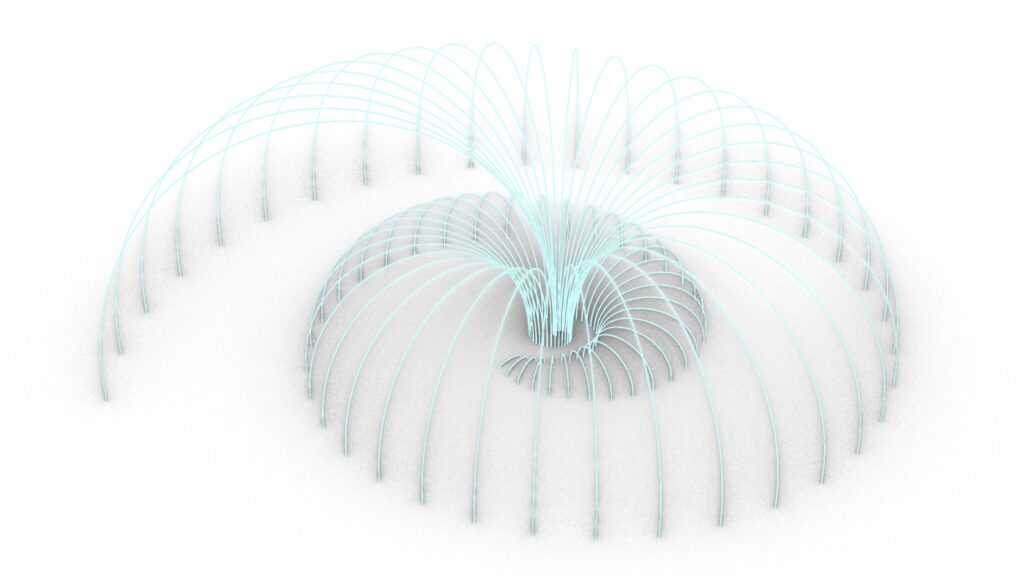
The image above shows the final rendering.
Click here to download the Grasshopper file
Please refer to the Terms of Use regarding the use of downloadable data.
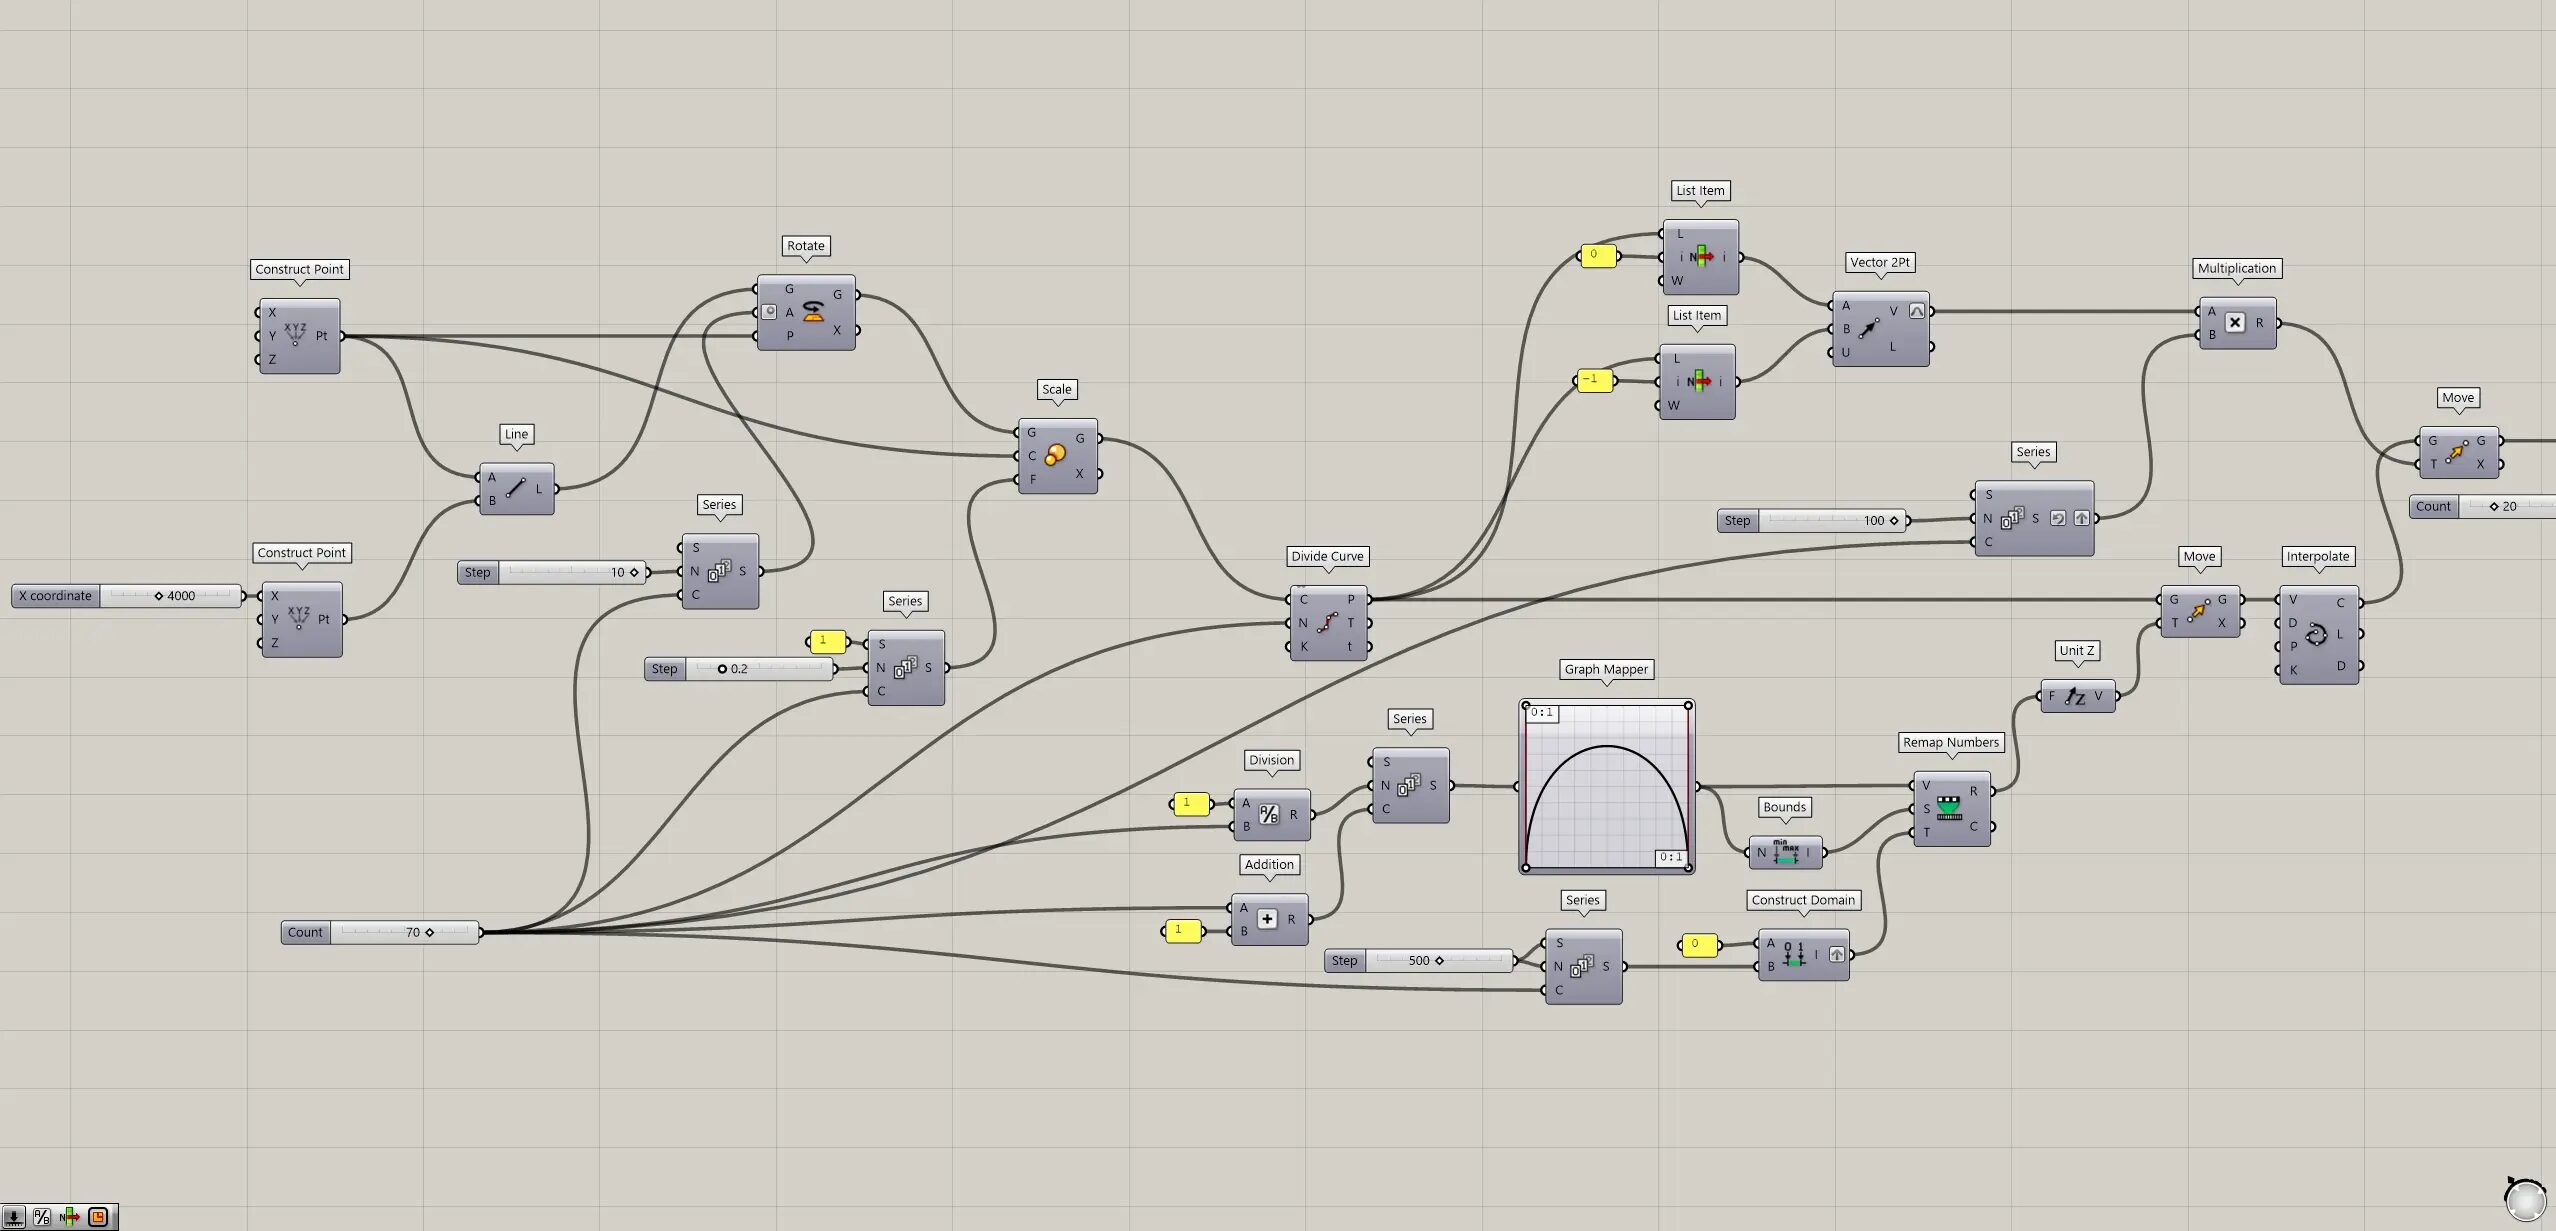
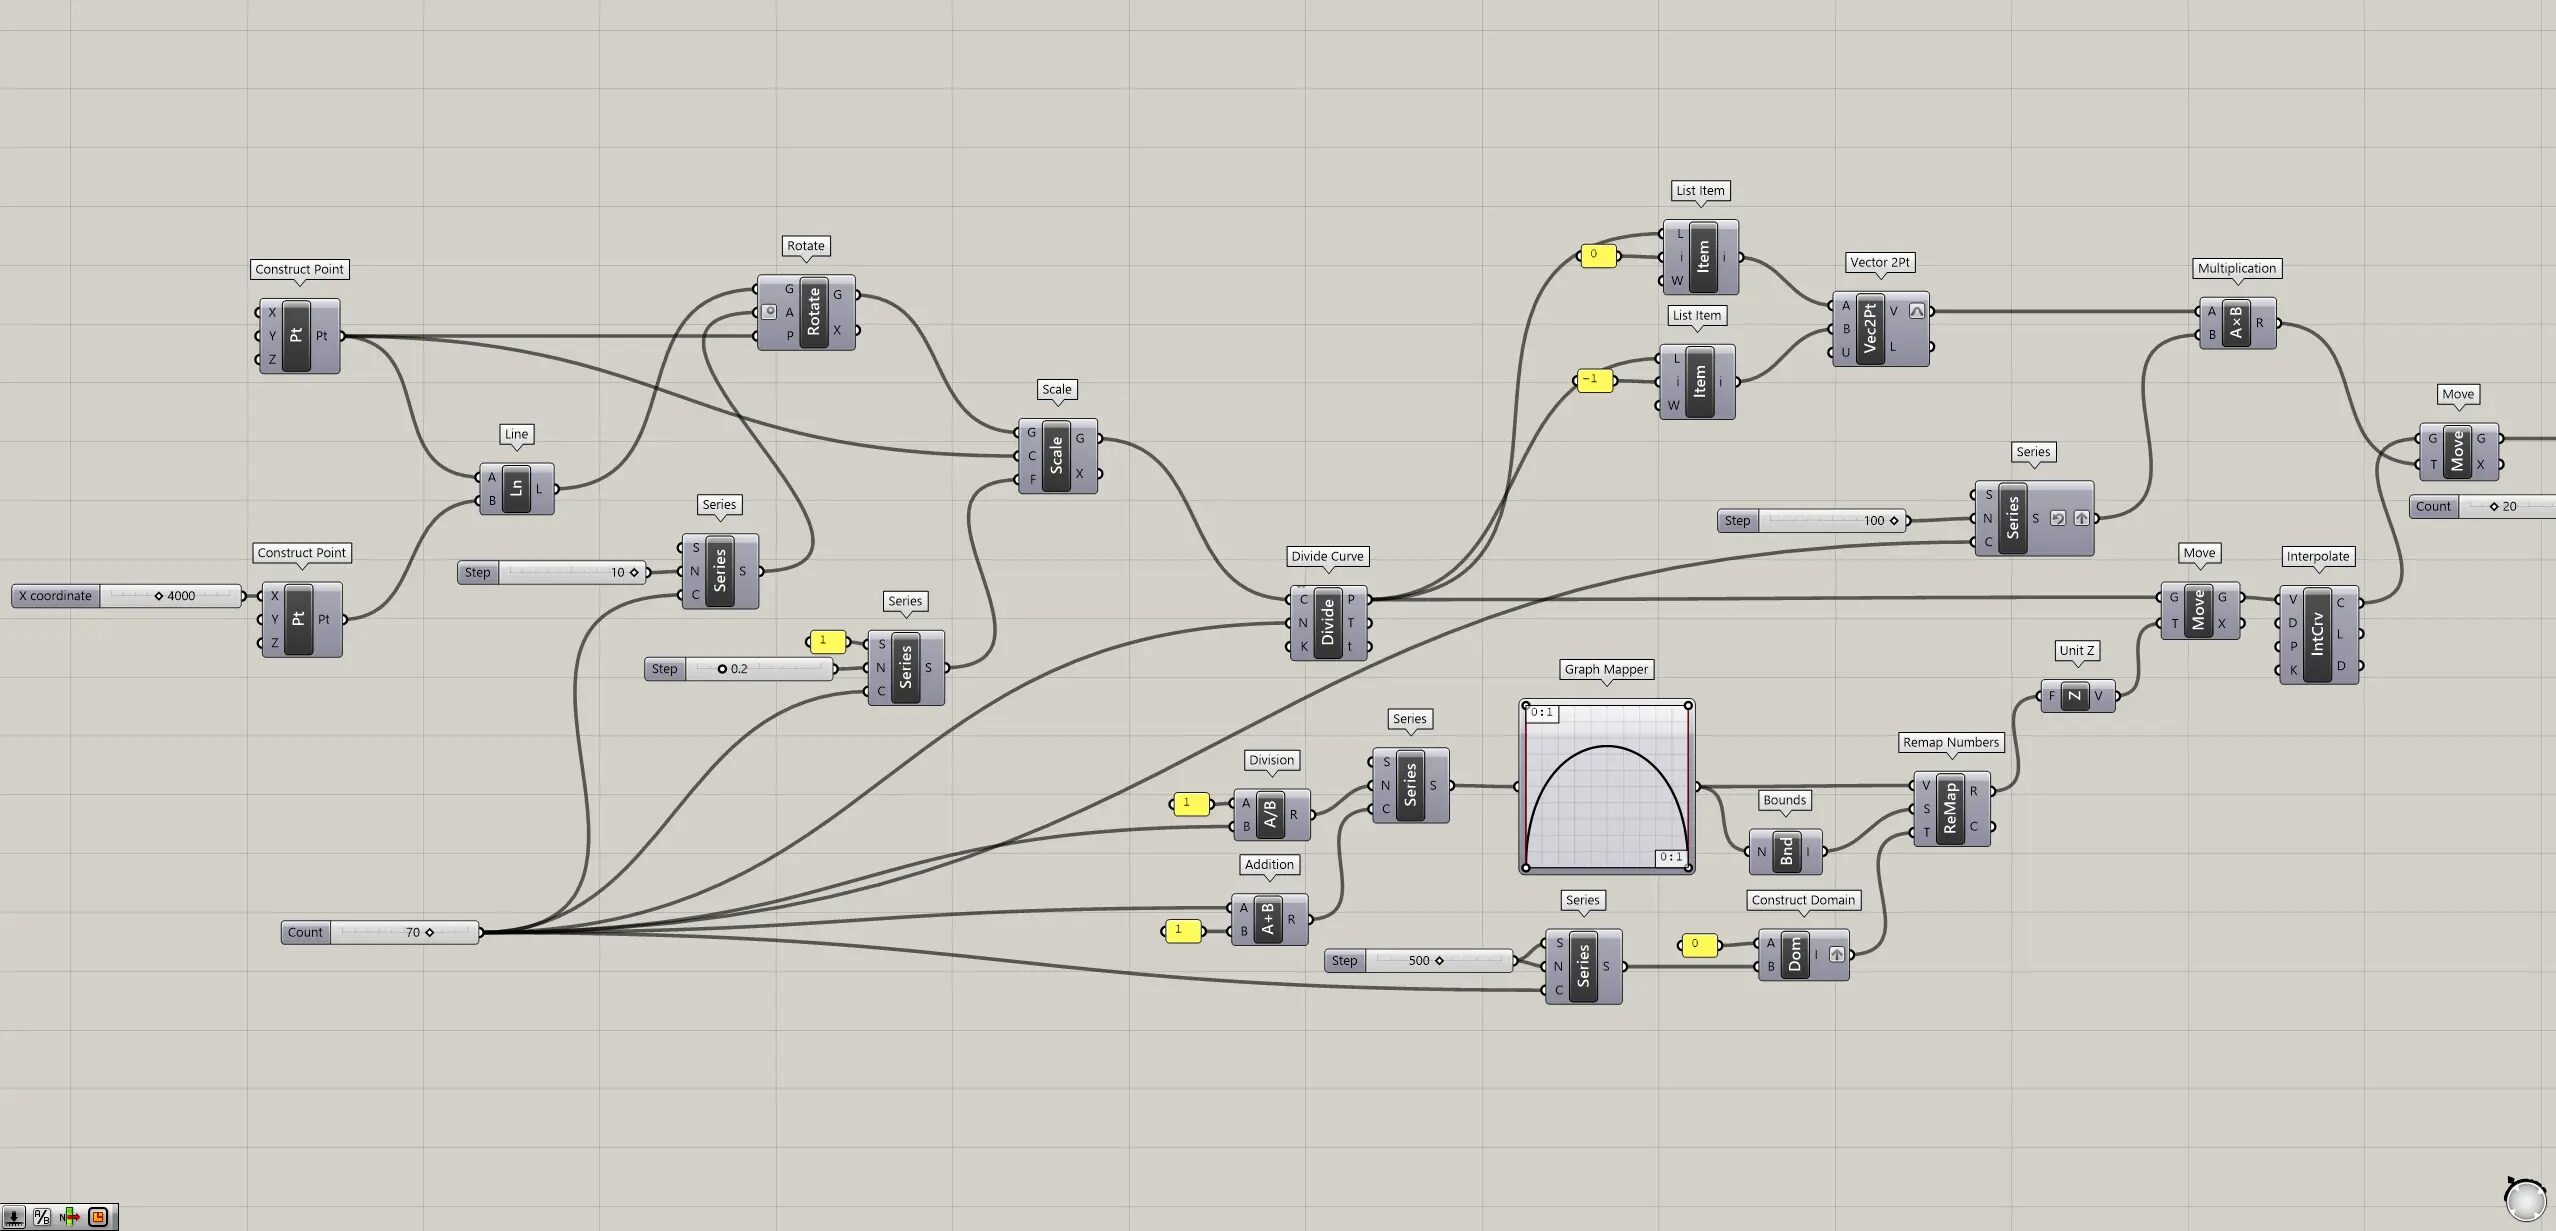
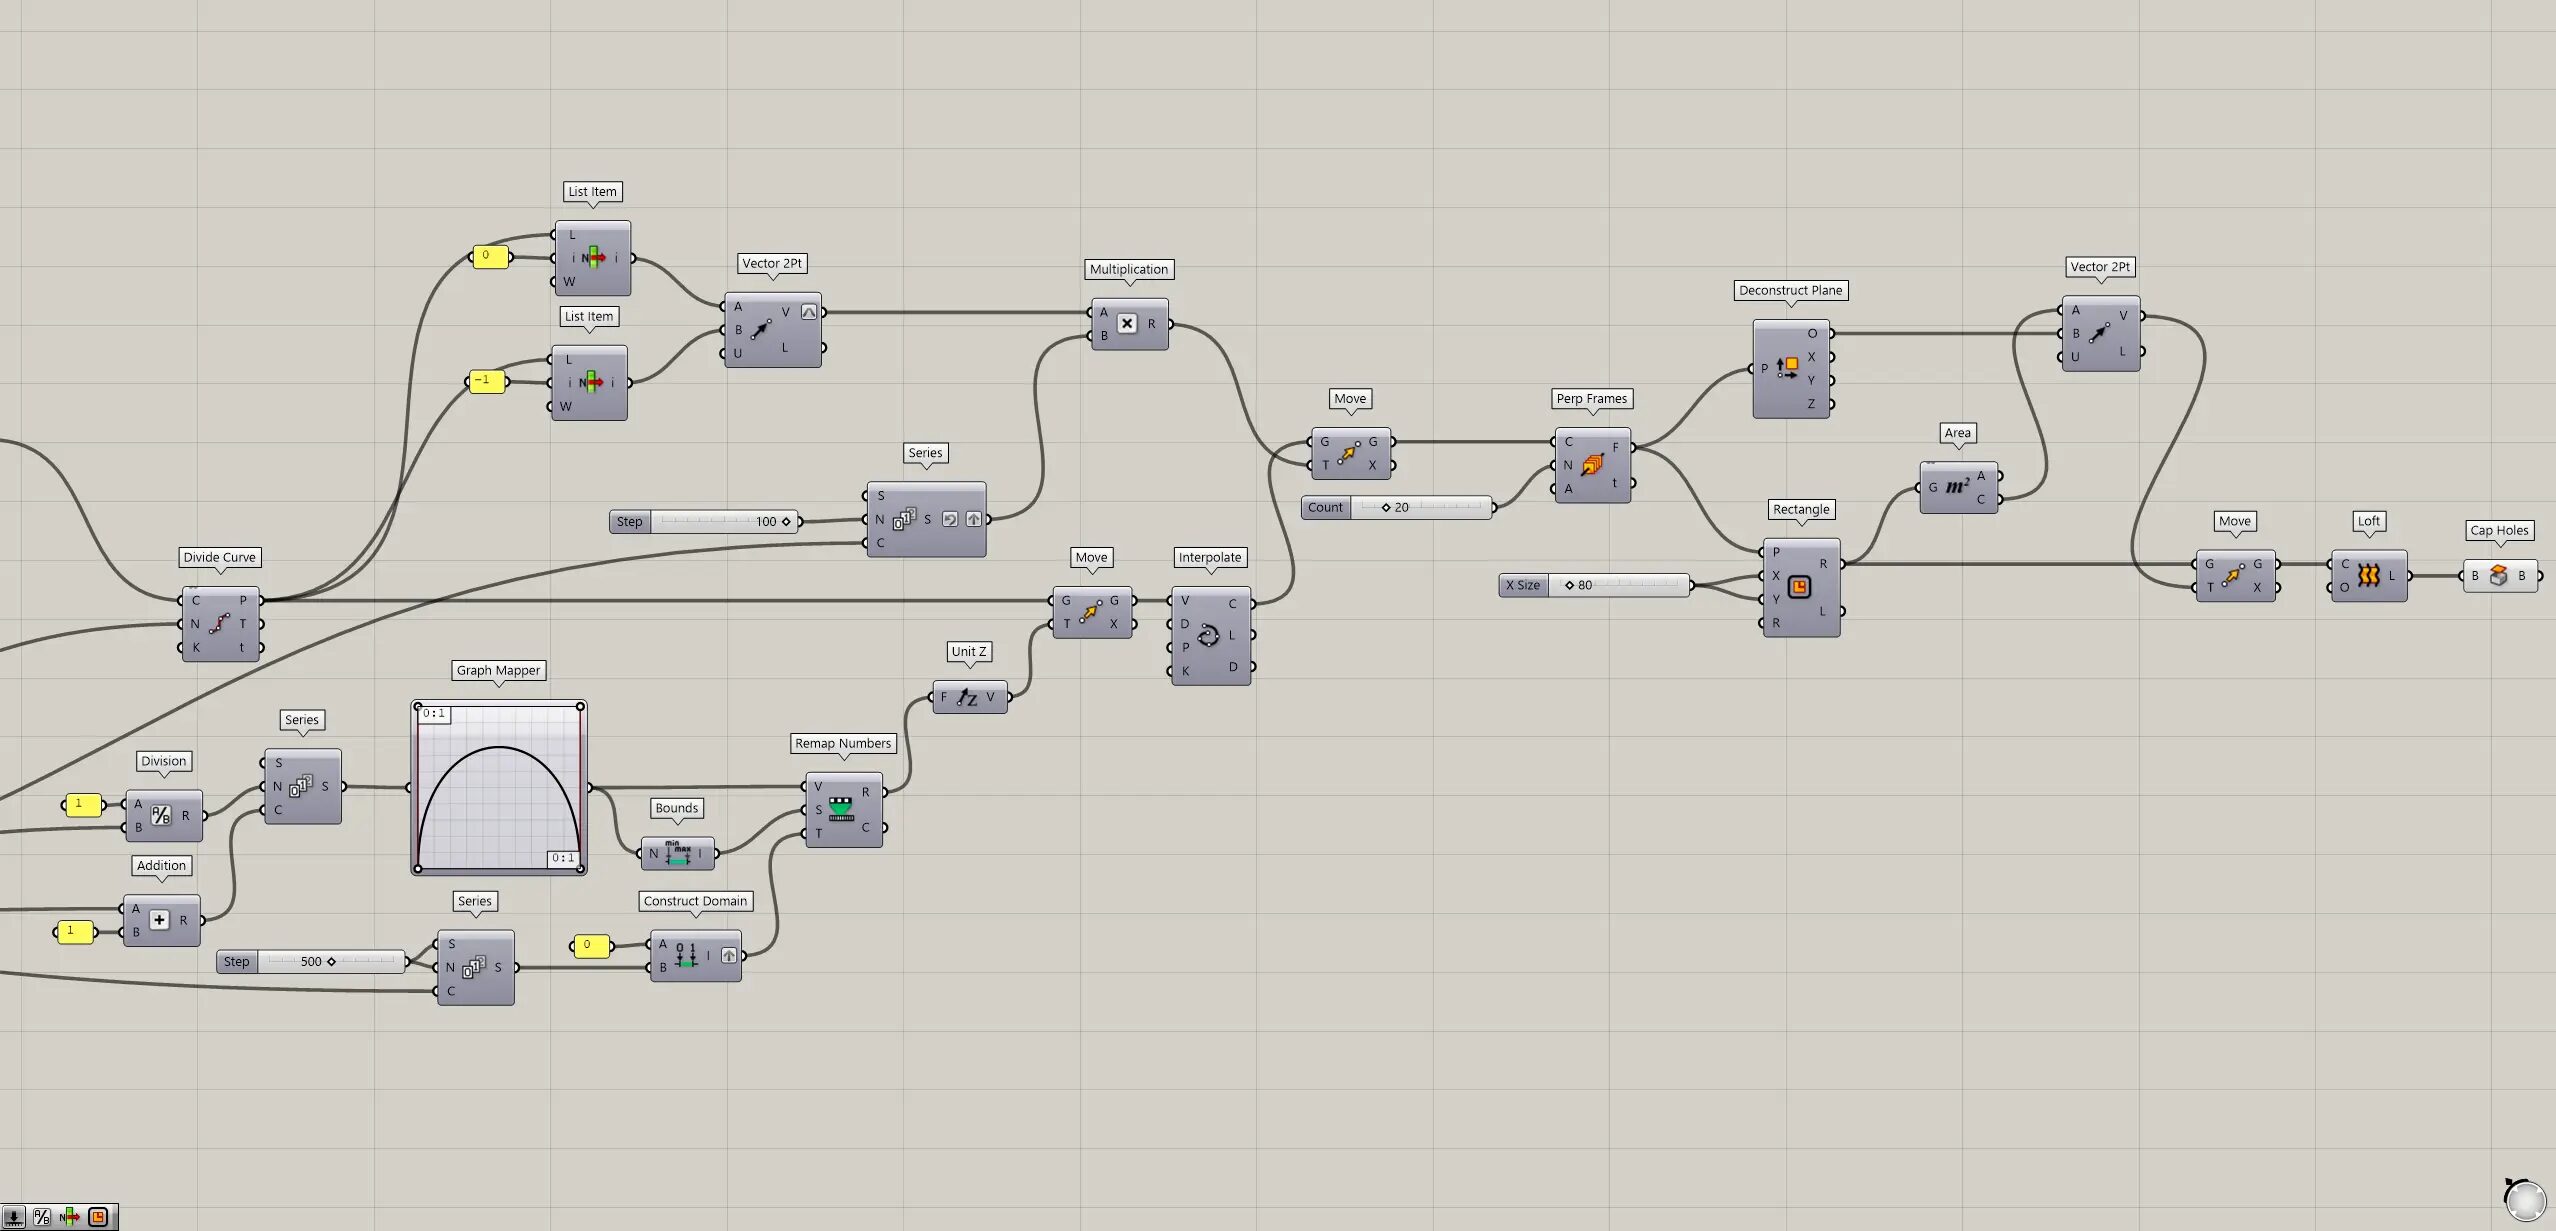
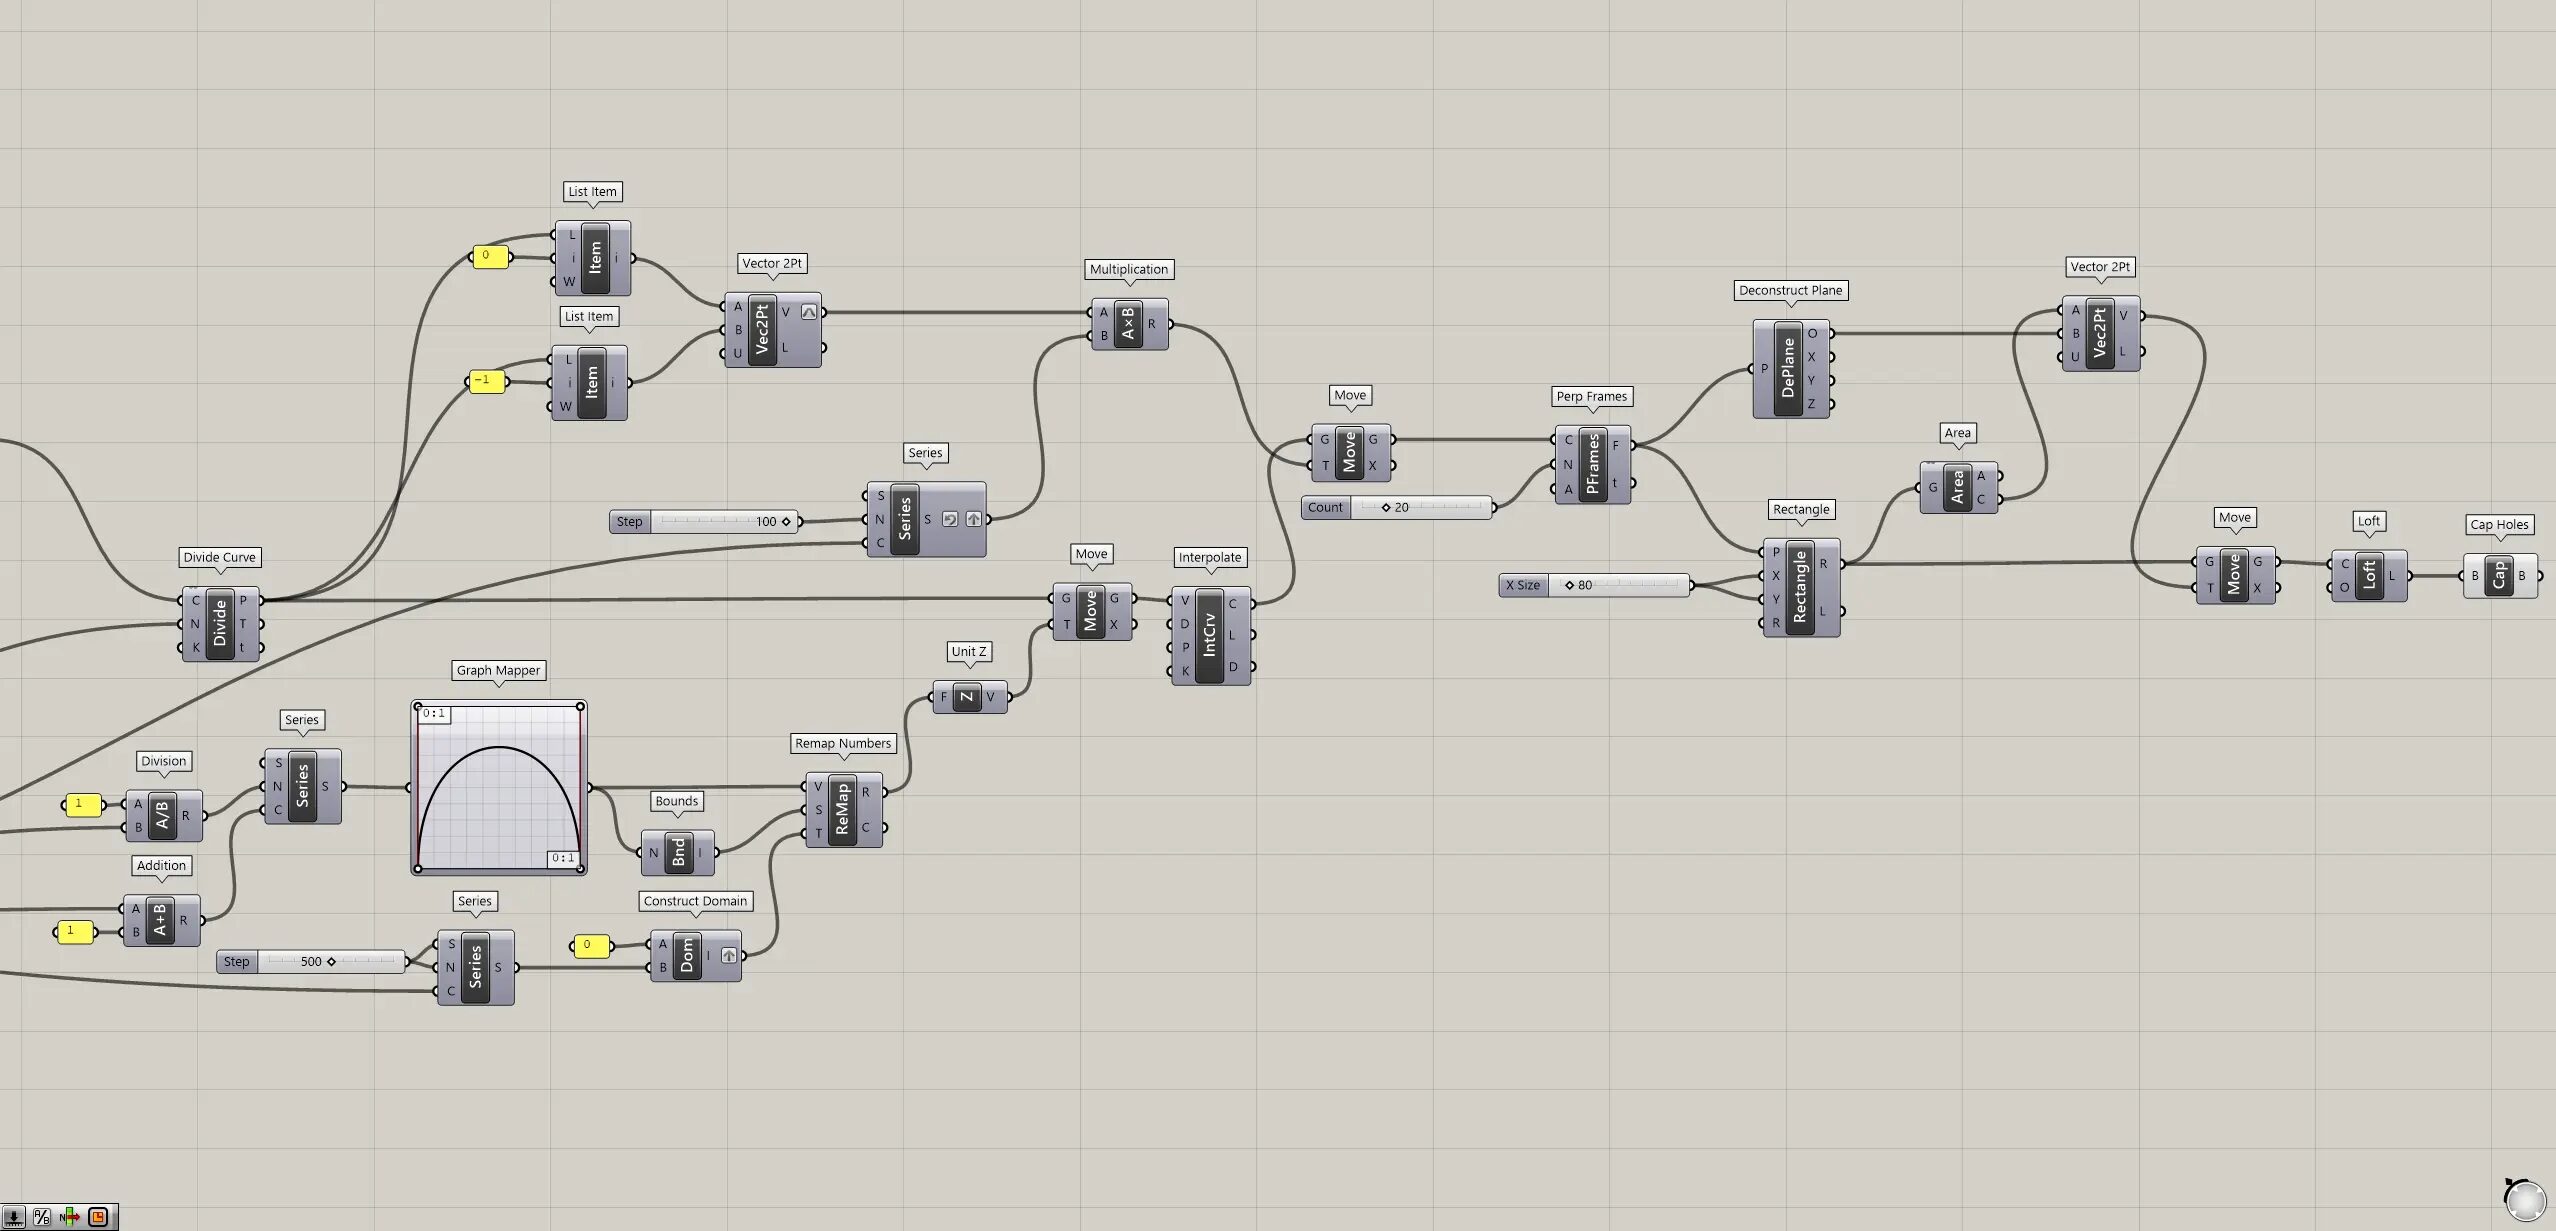
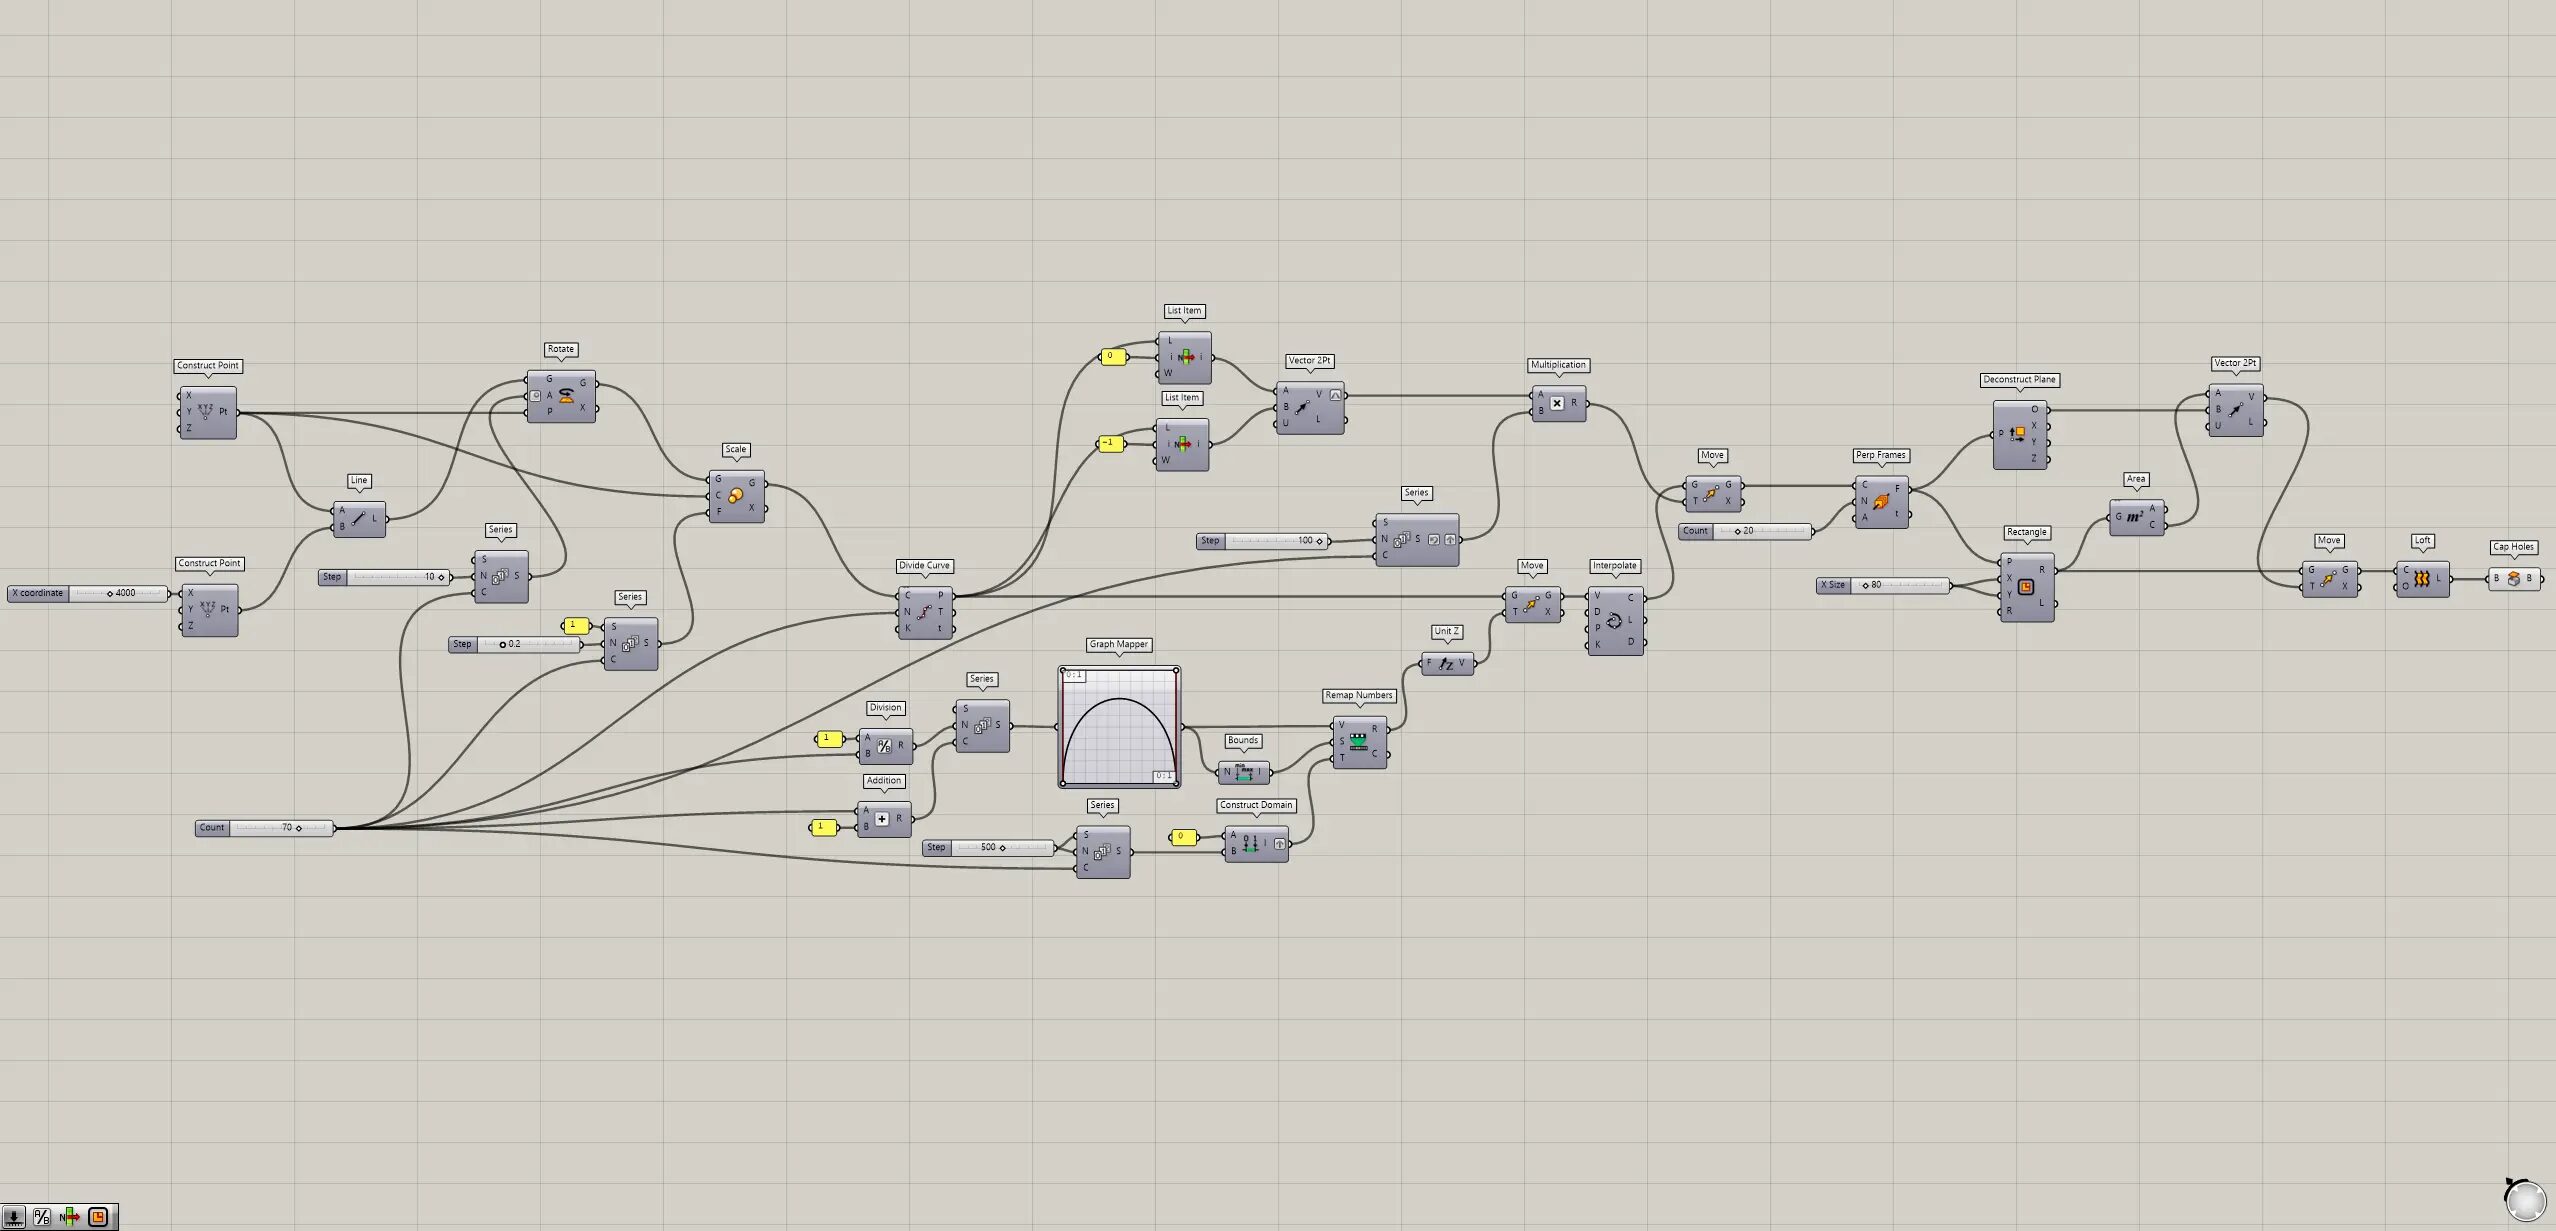
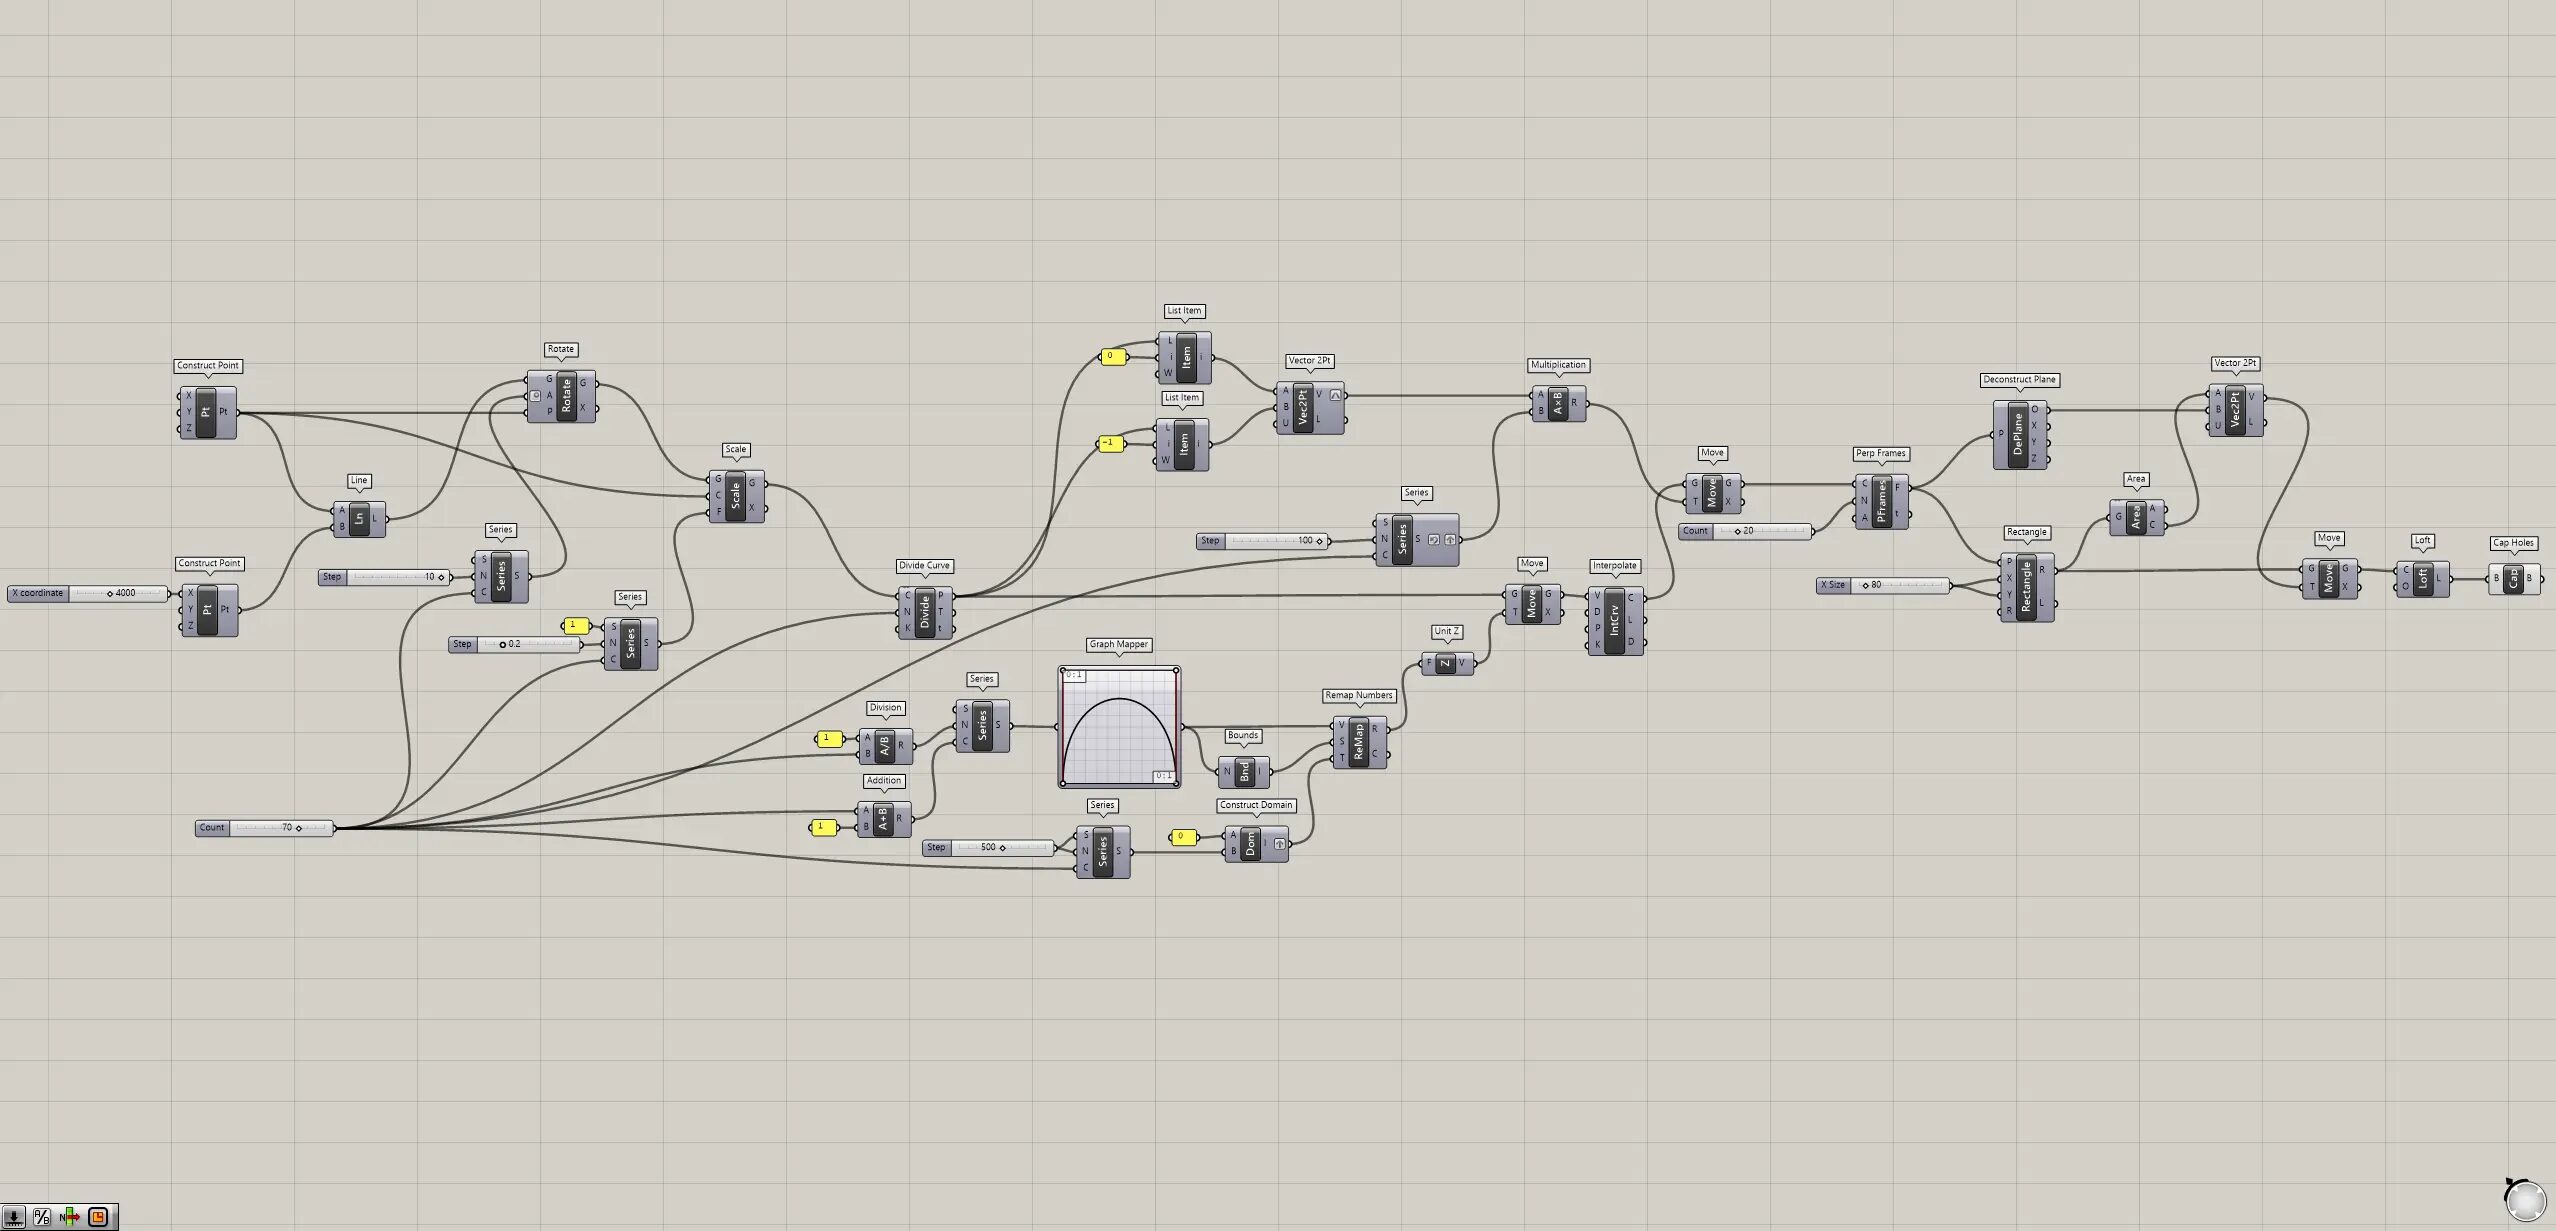
Grasshopper recipe
①Construct Point ②Line ③Rotate ④Series ⑤Scale ⑥Divide Curve ⑦Division ⑧Addition ⑨Graph Mapper ⑩Bounds ⑪Construct Domain ⑫Remap Numbers ⑬Unit Z ⑭Move ⑮Interpolate ⑯List Item ⑰Vector 2Pt ⑱Multiplication ⑲Perp Frames ⑳Rectangle ㉑Area ㉒Deconstruct Plane ㉓Loft ㉔Cap Holes
Rotate and rescale lines
First, create lines and rotate the line and further change the scale.
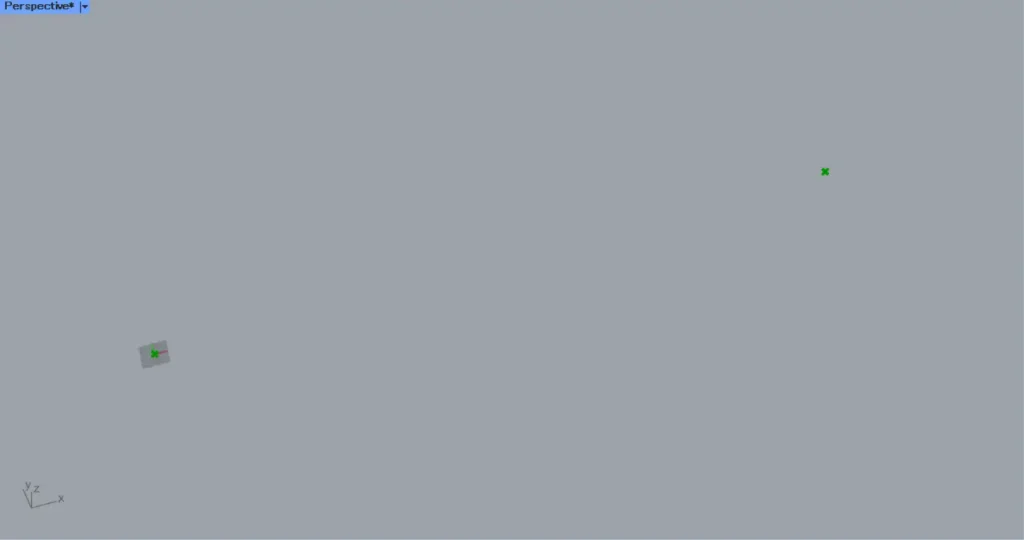
Place two Construct Point.
For the first one, leave it as is, and for the second one, enter a numerical value for the X coordinate in Construct(X).
This time, 4000 is entered.
Then points are created at coordinates 0,0,0 and 4000,0,0 as shown in the image above.
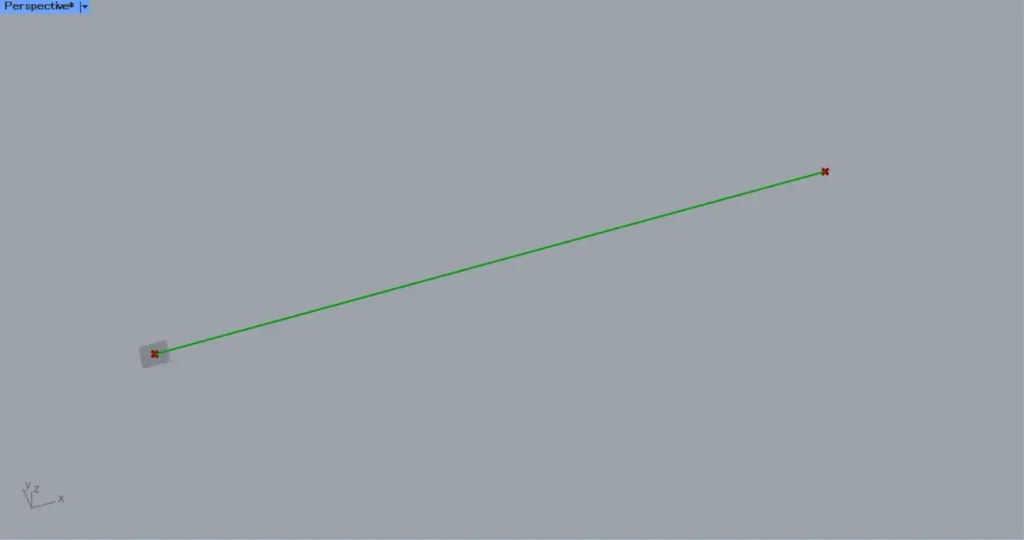
Then connect the two Construct Point to a Line.
Then a line is created connecting the two points, as shown in the image above.
Next, we will create the numerical values of the angles to be rotated.
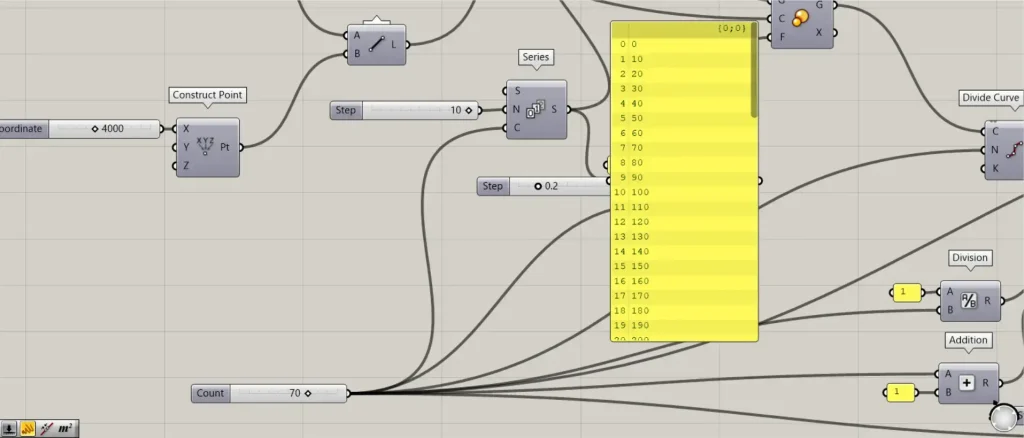
Connect the numerical values for the number lines to a Series(C).
In this case, 70 is entered.
Furthermore, connect the angle values to Series(N).
This time, 10 is entered.
Then 70 numbers will be created, increasing by 10 from 0.
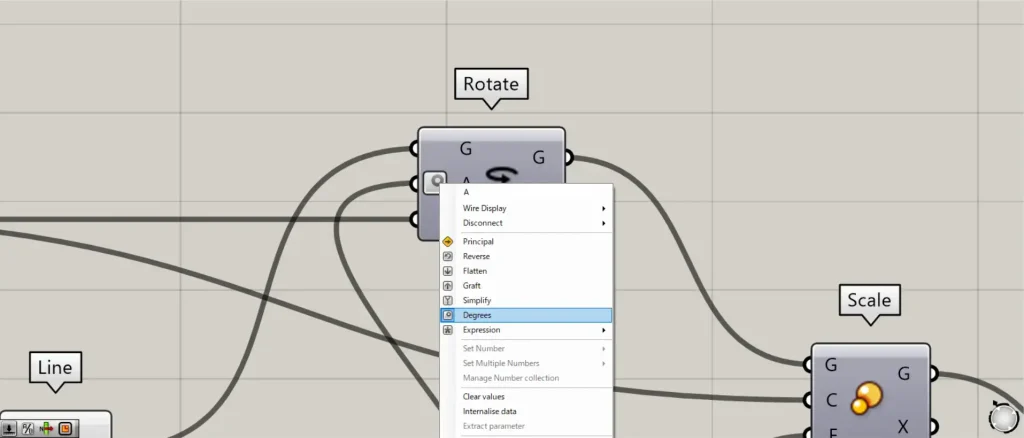
Then connect the Series to a Rotate(A).
At this point, right click on the Rotate(A) and set it to Degrees.
Furthermore, connect the Construct Point of the one with no input from earlier to the Rotate(P).
In addition, connect the Line to the Rotate(G).
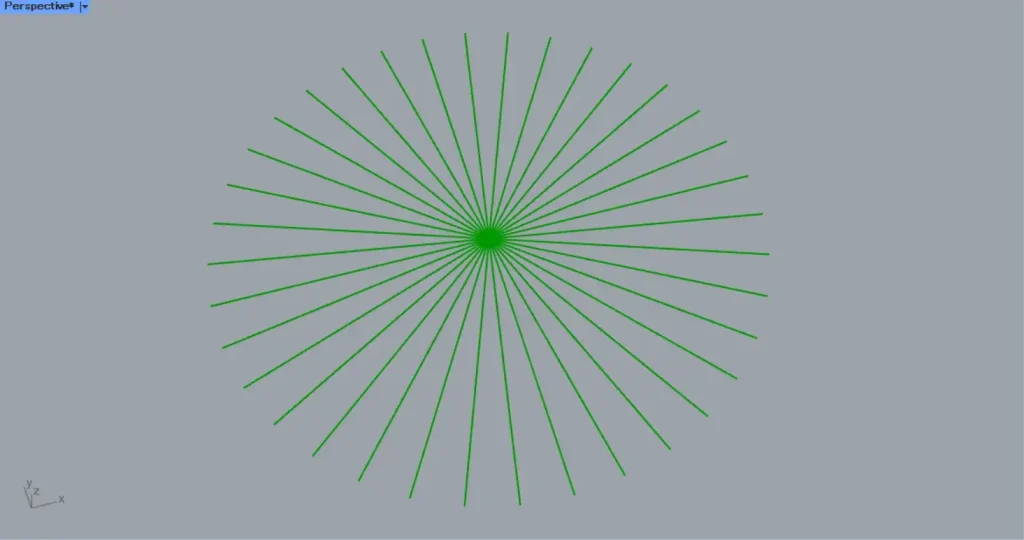
Then the lines are rotated and copied, as shown in the image above.
Next, create numbers that changes the scale.
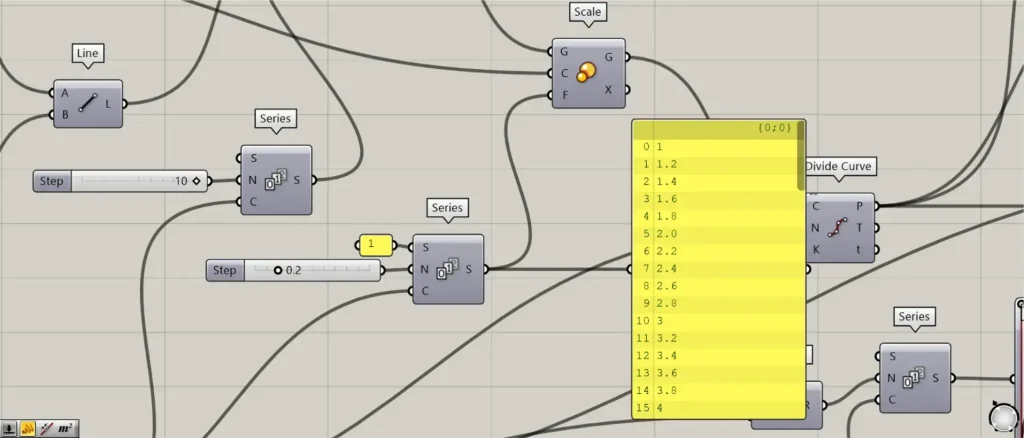
Connect the previous 70 to a Series(C).
Further, connect 1 to the Series(S).
Further, connect 0.2 to the Series(N).
Then 70 numbers are created, increasing by 0.2 from 1.
Then connect the Series to a Scale(F).
Furthermore, connect the Construct Point of the one with no input from earlier to the Scale(C).
In addition, connect the Rotate(G) to the Scale(G).
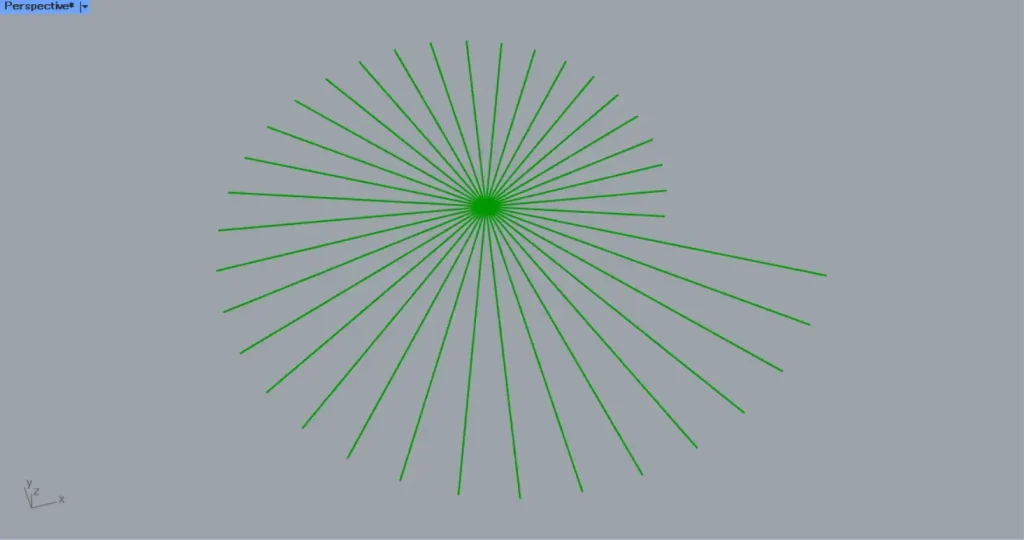
Then the line scales changed, as shown in the image above.
Create arched lines
Next, we will create arched lines.
Connect the Scale(G) to a Divide Curve(C).
Furthermore, connect the number of divisions to the Divide Curve(N).
In this case, 70 is input.
Then points are created at the positions where each line is divided into 70, as shown in the image above.
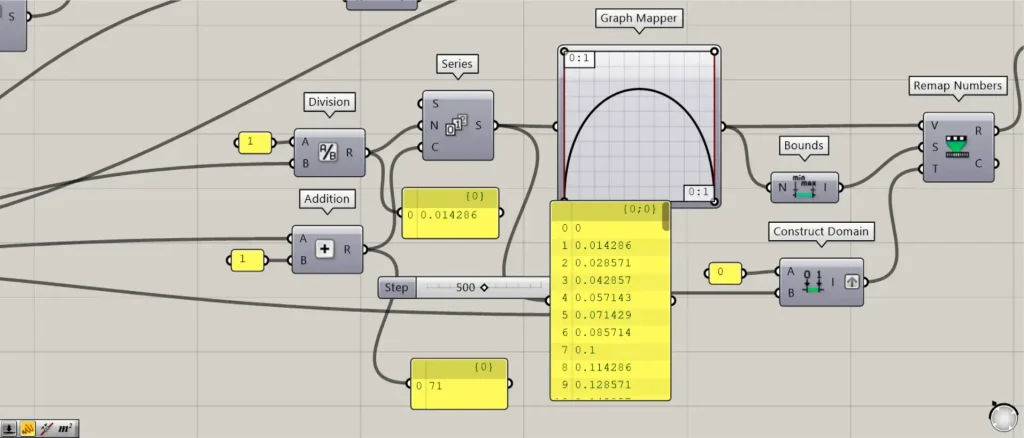
Then connect the previous 70 to a Division(B).
In addition, connect 1 to the Division(A).
Then the number 1 divided by 70 is output.
This number will be the X-axis number for the graph we will use later.
Furthermore, connect the 70 and 1 from earlier to an Addition.
Then 70+1=71 is output.
This adds 1 to the number of points, since there are 71 points.
Then connect the Division to a Series(N).
In addition, connect the Addition to the Series(C).
Then 71 numbers are created, increasing by 1/70 from 0.
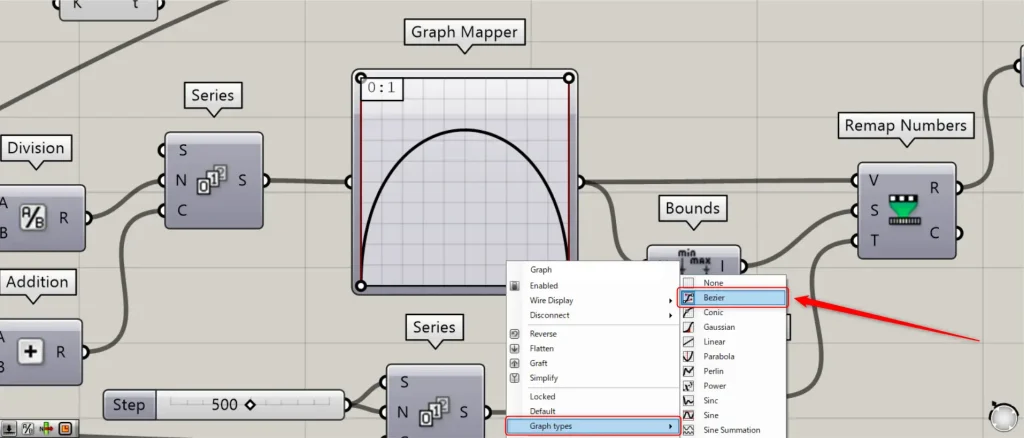
Then connect the Series to a Graph Mapper.
At this point, right click on the Graph Mapper and set it to Bezier from Graph types.
Furthermore, refer to the image above to set the shape of the graph.
Then the Graph Mapper outputs the Y-axis value corresponding to the X-axis value you entered.
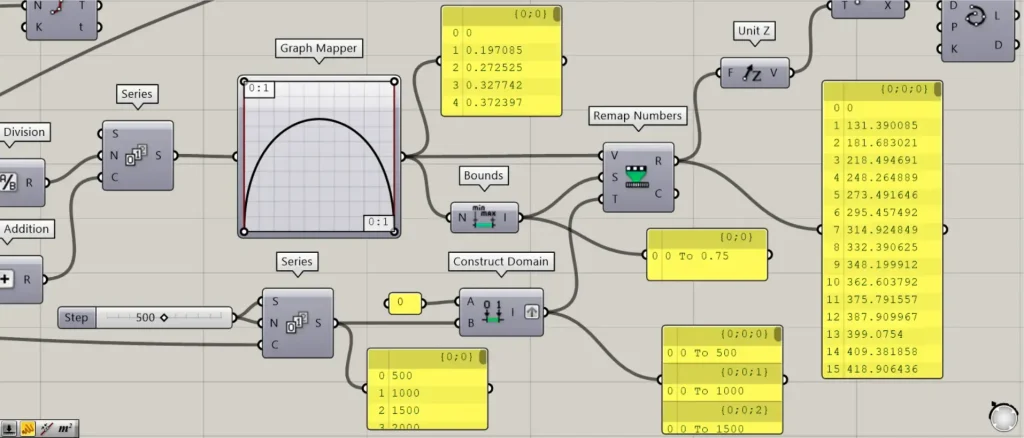
Then connect the Graph Mapper to a Bounds.
This creates a numeric range consisting of the minimum and maximum values of the numbers output from the Graph Mapper.
Then connect the previous 70 to a Series(C).
In addition, connect 500 to the Series(S and N).
Then 70 numbers will be created, increasing by 500 from 500.
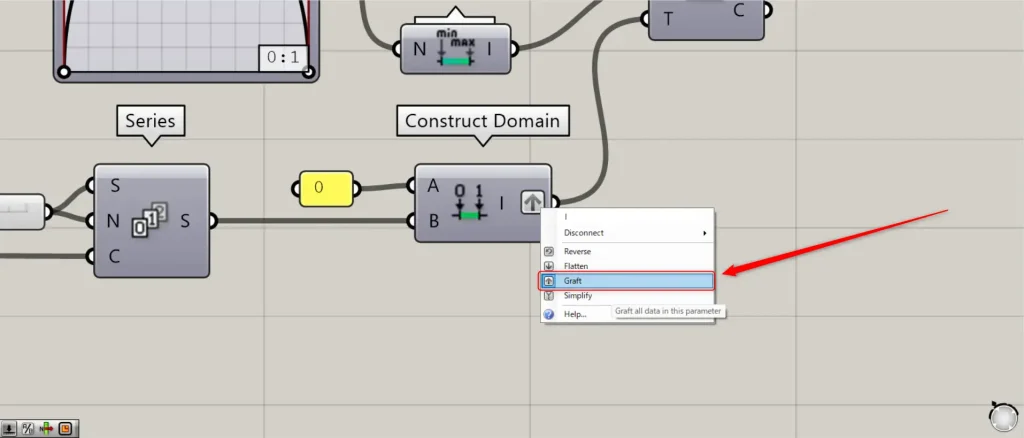
Then connect the Series to a Construct Domain(B).
In addition, connect the number 0 to the Construct Domain(A).
This creates 70 numeric ranges.
At this time, right click on the Construct Domain(I) and set it to Graft.
Then connect the Graph Mapper to a Remap Numbers(V).
In addition, connect the Bounds to the Remap Numbers(S).
In addition, connect the Construct Domain to the Remap Numbers(T).
Then the numbers output from Graph Mapper changed the numbers accordingly within the new number ranges.
Then connect the Remap Numbers(R) to an Unit Z.
In addition, connect the Unit Z to a Move(T).
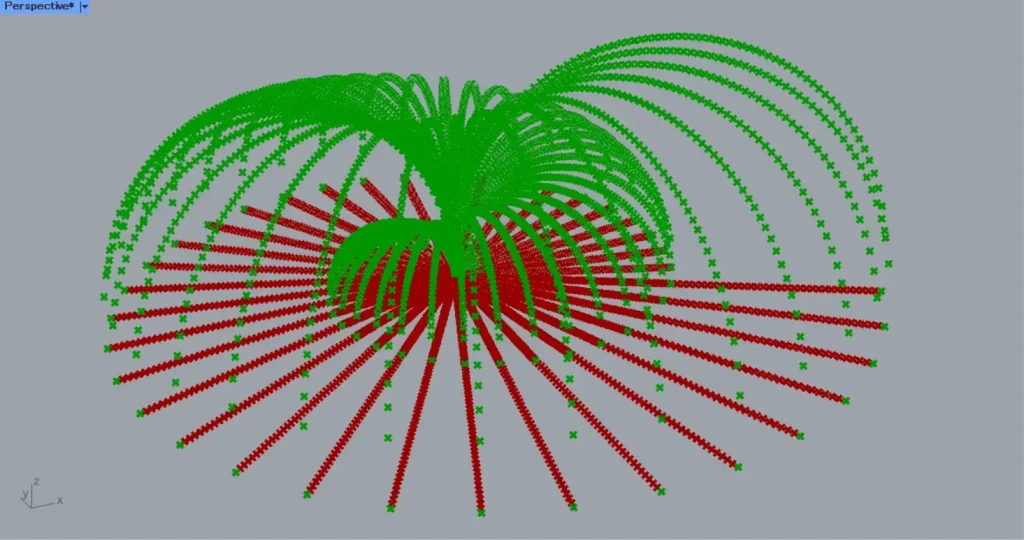
In addition, connect the Divide Curve(P) to the Move(G).
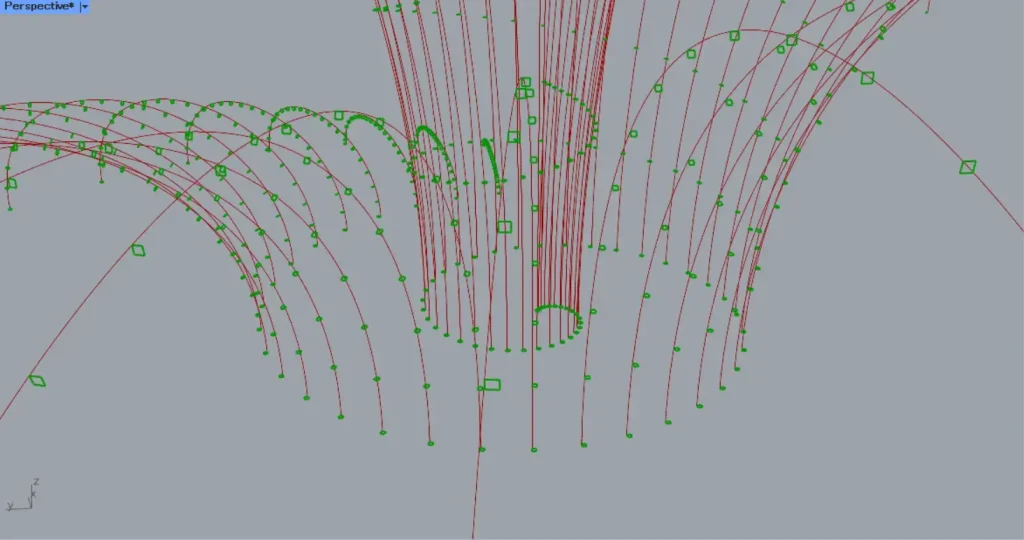
Then, as shown in the image above, the points moved like an arc.
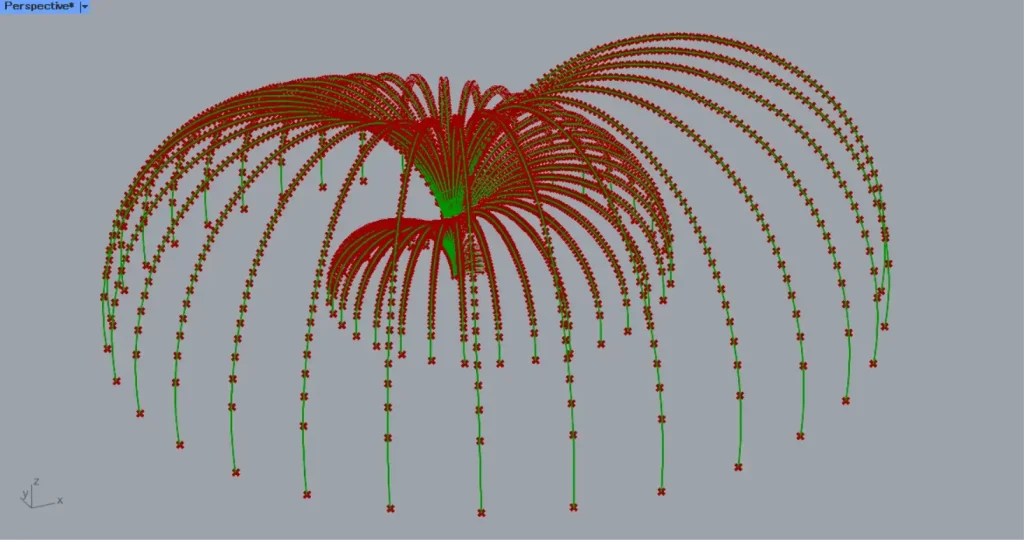
Then connect the Move(G) to an Interpolate(V).
Then curves connecting the points are created, as shown in the image above.
Move the curves from the center outward
Next, move the curves outward from the center.
Connect the Divide Curve(P) to two List Item(L).
Connect 0 to the first List item(i).
Then you get the first point.
Connect -1 to the second List item(i).
Then you can get the last point.
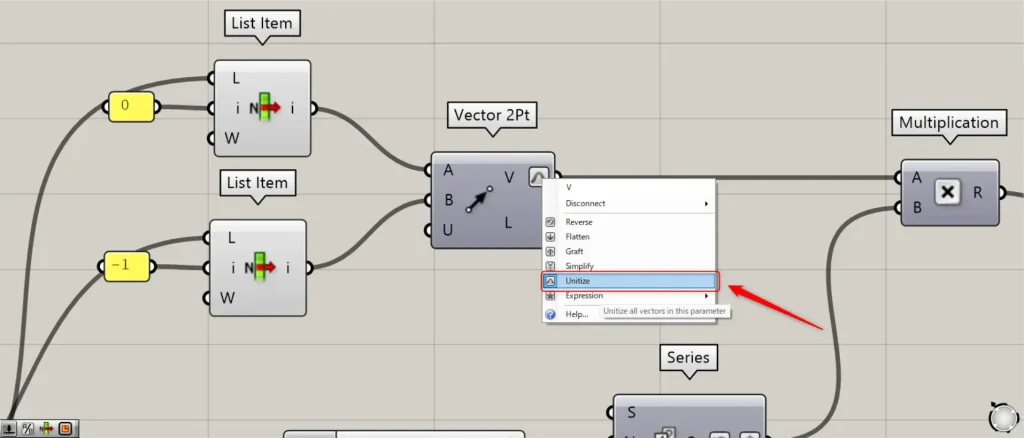
Then connect the first List item to a Vector 2Pt(A).
Furthermore, connect the second List item to the Vector 2Pt(B).
At this point, right click on the Vector 2Pt(V) and set it to Unitize.
Then you can get the vector from the first point to the second point.
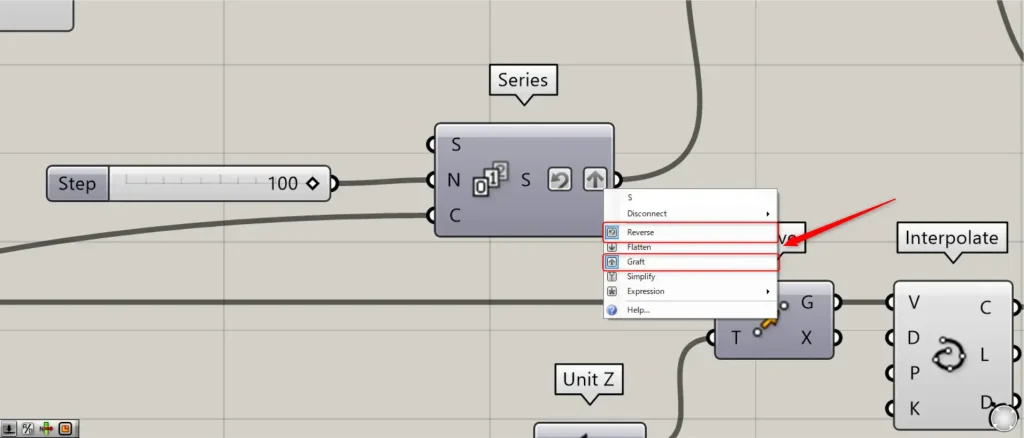
Then connect the previous 70 to a Series(C).
Further, connect 100 to the Series(N).
At this time, right click on the Series(S) and set it to Reverse and Graft.
Then 70 numbers are created, increasing by 100 from 0.
I’m setting it to Reverse, so the order is from the last 6900 to the smallest.
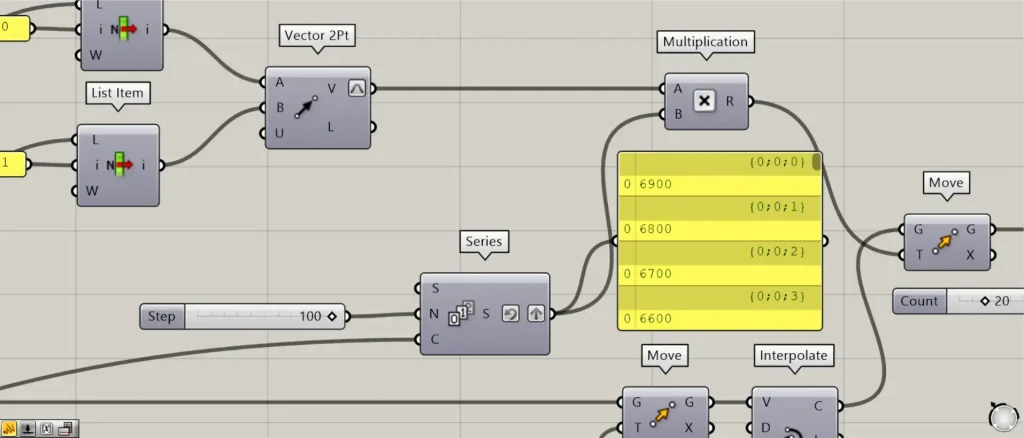
Then Connect the Series and the Vector 2Pt(V) to a Multiplication.
Then connect the Multiplication to a Move(T).
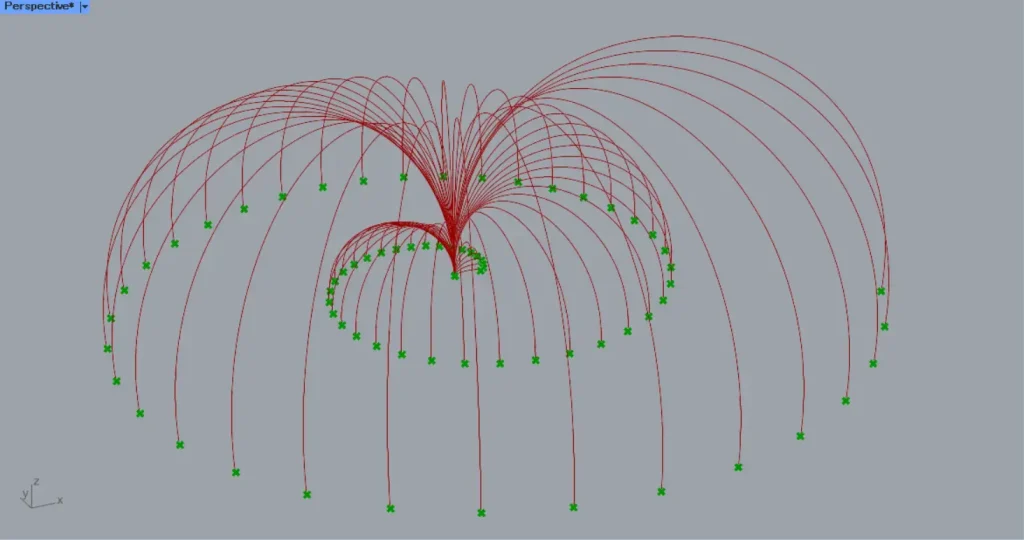
In addition, connect the Interpolate(C) to the Move(G).
Then each curve moves from the center outward, as in the image above.
Now the lines are not overlap.
Create surfaces connecting squares.
Finally, create surfaces connecting squares.
Connect the Move(G) to a Perp Frames(C).
Furthermore, the number of planes is connected to the Perp Frames(N).
This time, 20 is input.
Then 20 planes are created on each curve.
Then connect the Perp Frames(F) to a Rectangle(P).
In addition, enter the side length values in the Rectangle(X and Y).
This time, 80 is entered for both.
Then square lines created in each curve, as shown in the image above.
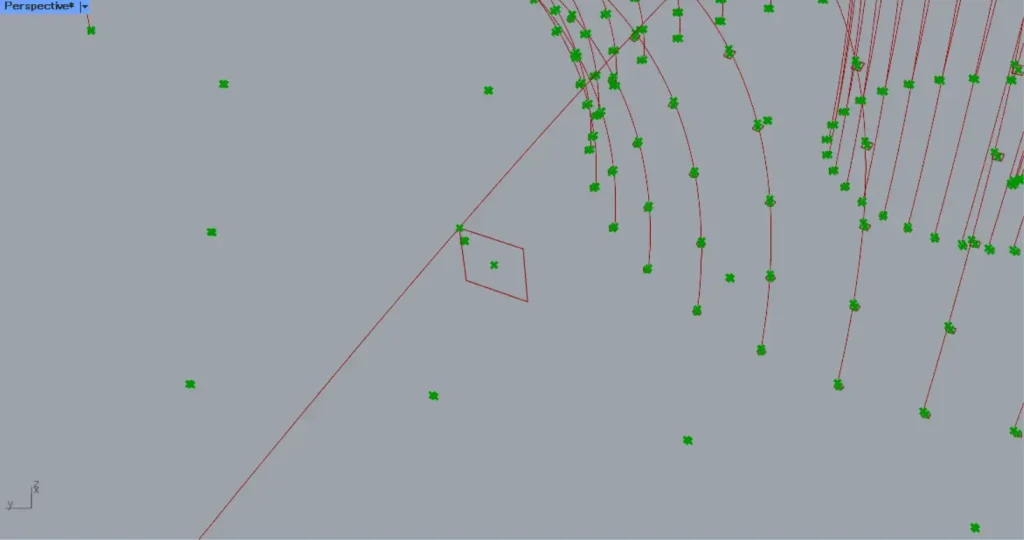
Then connect the Perp Frames(F) to a Deconstruct Plane.
Then you can get the points of the origins of the planes.
In addition, connect the Rectangle(R) to an Area.
Then you can get the points of the centers of the rectangles.
Then connect the Area(C) to a Vector 2Pt(A).
In addition, connect the Deconstruct Plane(O) to the Vector 2Pt(B).
Then you can get the vector data from the center points of the squares to the origin of the planes.
Then connect the Vector 2Pt(V) to a Move(T).
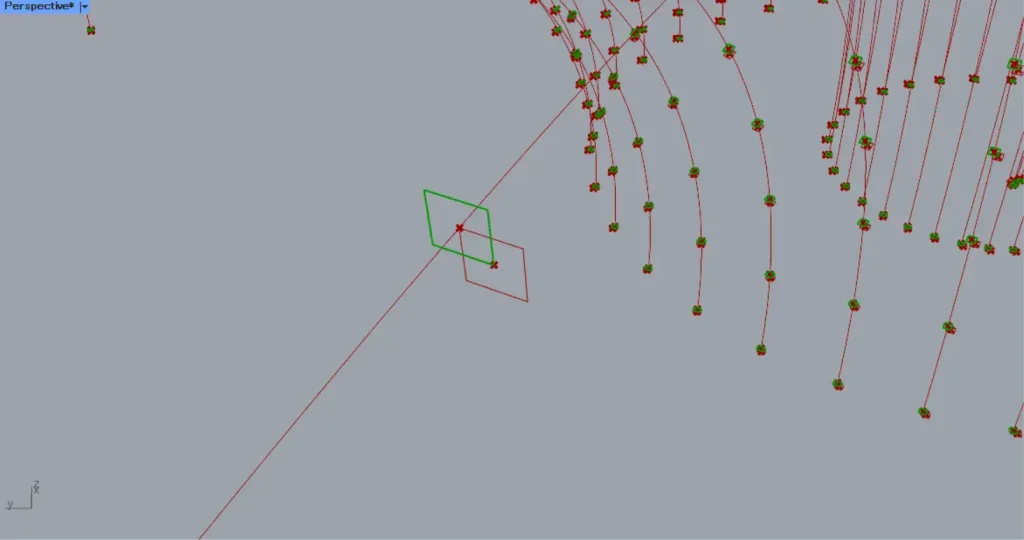
In addition, connect the Rectangle(R) to the Move(G).
Then the square lines move to positions centered at the origin of the planes, as shown in the image above.
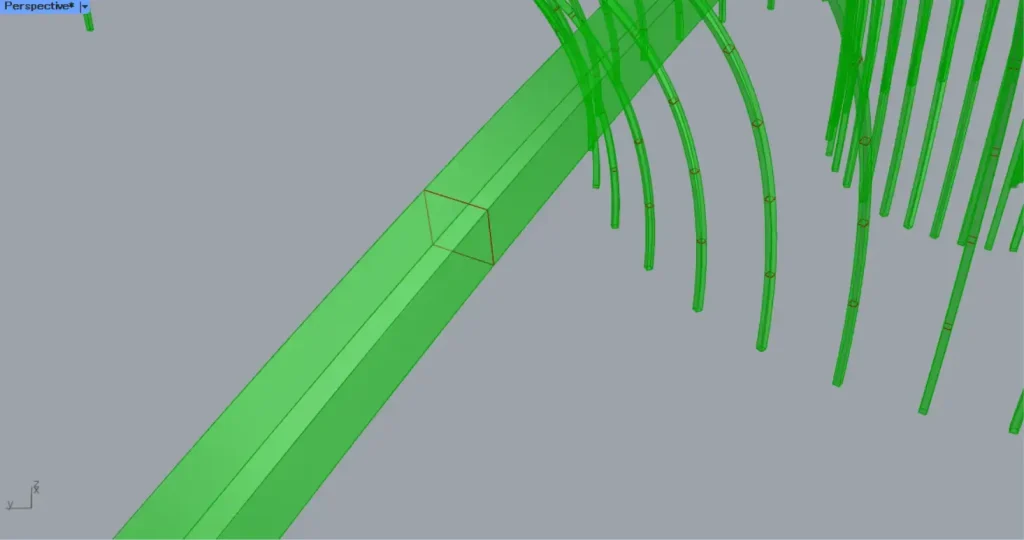
Then connect the Move(G) to a Loft(C).
Then surfaces are created by connecting the lines of the squares, as shown in the image above.
Finally, connect the Loft to a Cap Holes and plug the holes.
That’s all for this time.

Comment