
![[Grasshopper] How to use Graft as one method for manipulating data structures](https://iarchway.com/wp-content/uploads/2025/09/Graft.png)
This article explains how to use Graft as one method for manipulating data structures.

When set to Graft, an upward-pointing arrow mark will appear at the edge of the component, as shown here.
Let’s take a look at each of them in turn.
Graft Settings and Effects
First, let’s look at the Graft settings and effects.
Components used: (1) Series
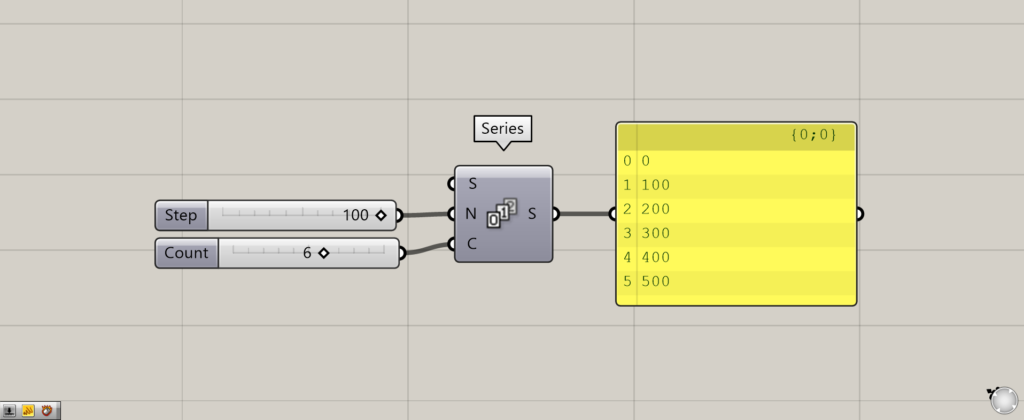
First, let’s look at the state before Graft is used.
As an example, we will use Series.
Series can create an equal-difference sequence. By inputting 100 to the Series(N) and 6 to the Series(C), 6 numbers were created, starting from 0 and increasing by 100.
The numbers 0, 100, 200, 300, 400, and 500 were then created.
Before Graft, the numbers 0, 100, 200, 300, 400, and 500 are grouped together in a branch of {0;0}.
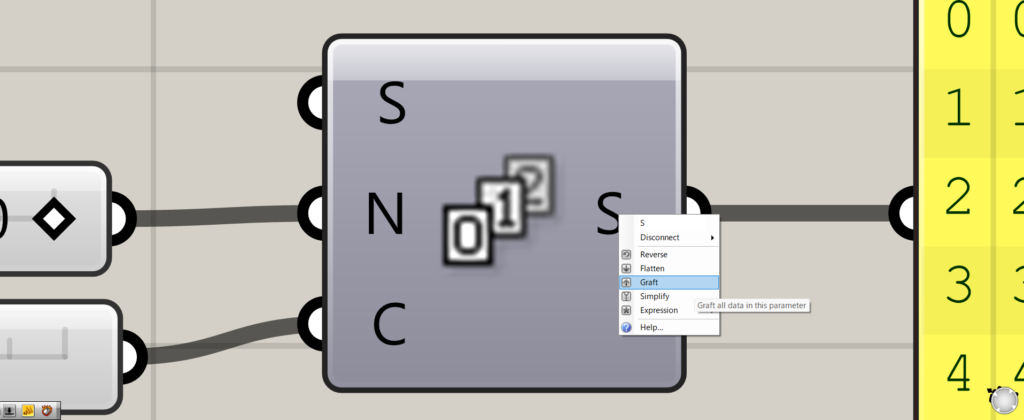
Let’s set them to Graft.
You can set it to Graft by right-clicking on the terminal and selecting Graft.
In this case, we set Graft to the Series(S).
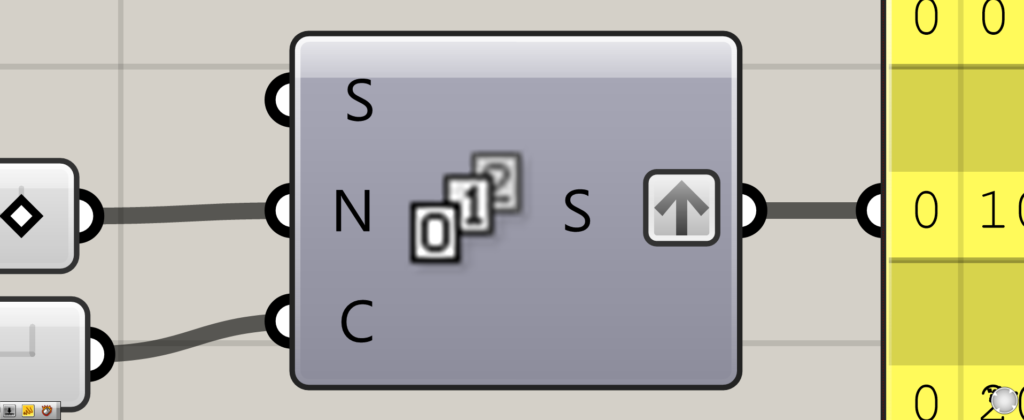
The Graft setting was completed as shown below.
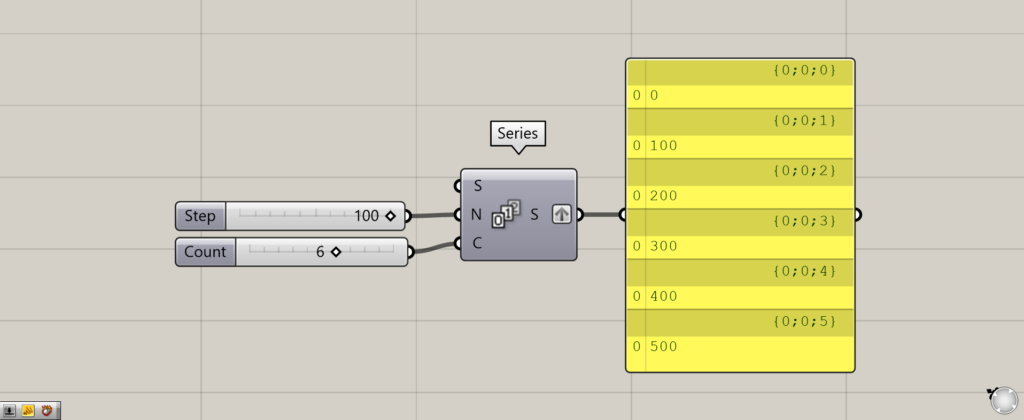
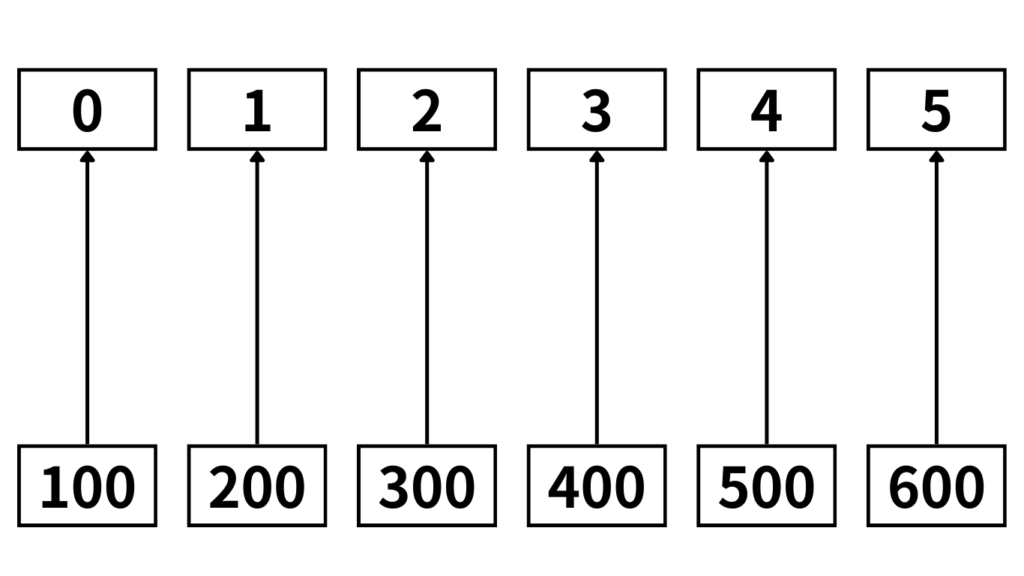
Then, the numbers 0, 100, 200, 300, 400, and 500 were assigned to the newly created {0;0;0}~{0;0;5} branch, respectively.
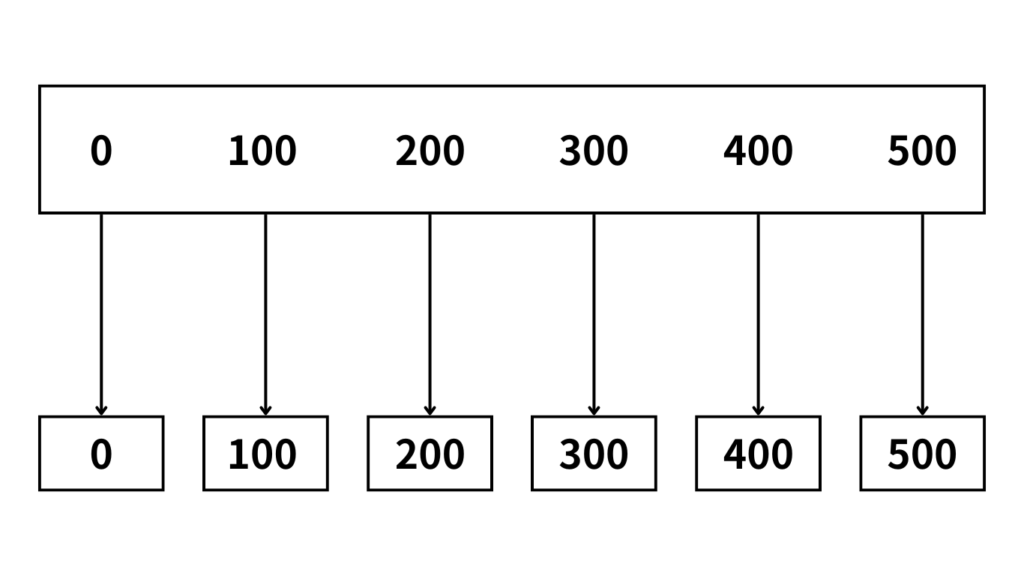
The data structure is easier to understand if you think of it as boxes.
Before Graft, six numbers (0~500) were grouped in one box.
After grafting, however, each of the six new boxes is assigned one value each.
Components used: (1) Entwine
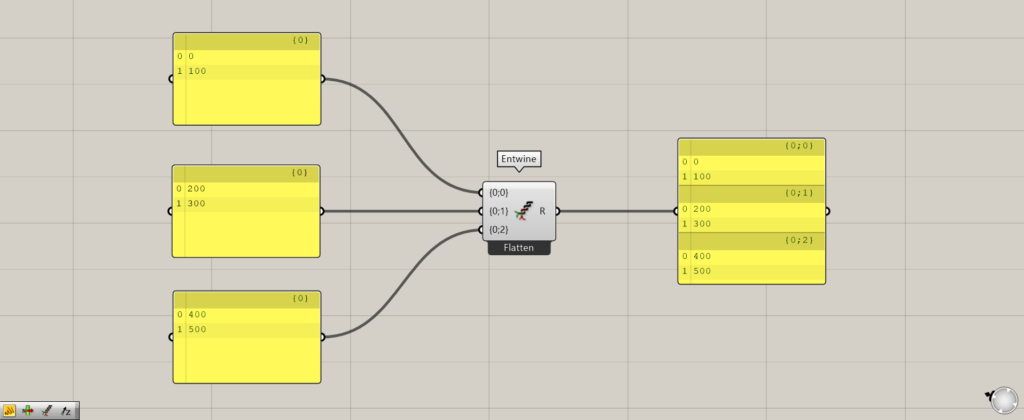
Now, the Entwine was used to input two numerical values each, and the data for each was grouped together.
We then look at the data with two numbers grouped together in one branch.
In this case, the values 0 and 100 are grouped together in the {0;0} branch, 200 and 300 in {0;1}, and 400 and 500 in {0;2}.
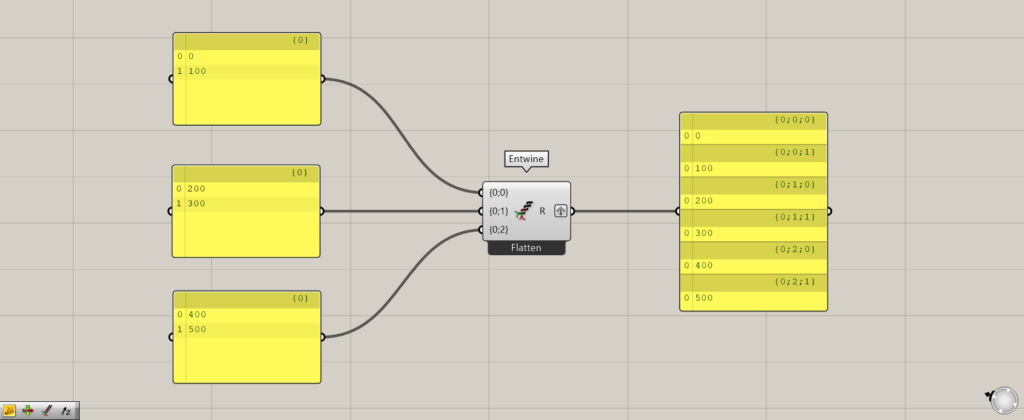
The Entwine(R) is set to Graft.
Then the {0;0}, {0;1}, and {0;2} branches are now six new branches, with one numerical value assigned to each new branch
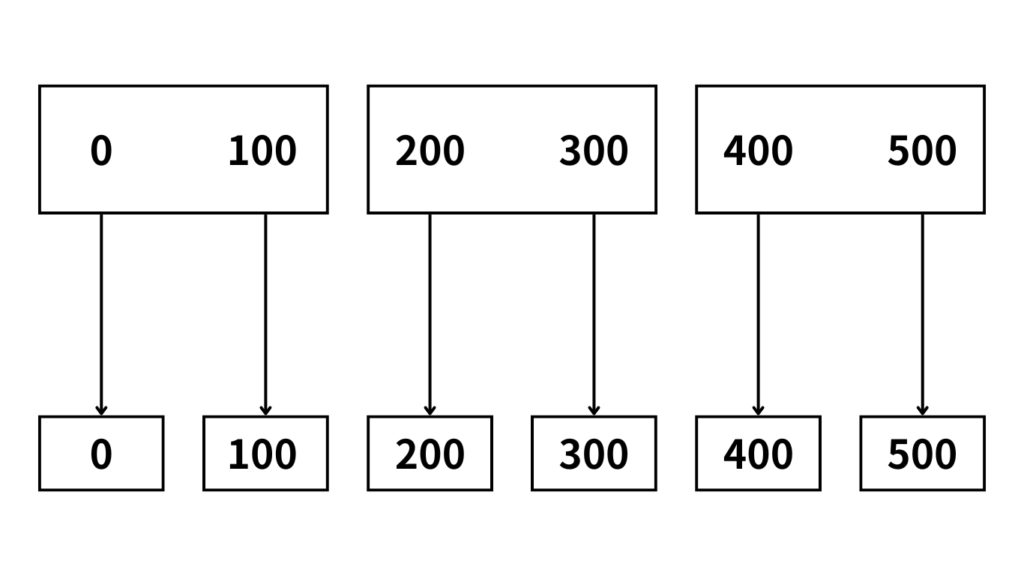
In this case, we also think of them as boxes.
Before grafting, the numbers were grouped into three boxes, two at a time.
After grafting, however, boxes are created for the number of values, and the values are assigned to each box one by one.
In this case, six new boxes are created, and each box is assigned a value.
By setting Graft in this way, a new branch is created for the number of boxes in the list, and data is assigned to each box one at a time.
Examples of Graft Usage
Let’s look at an example of Graft in use to see how it changes before and after use.
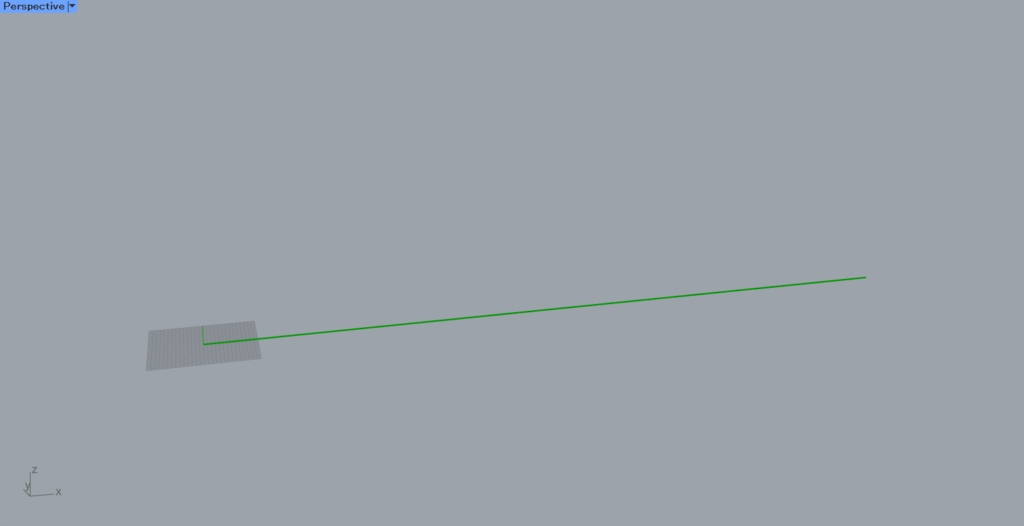
In this case, we will create a single line and divide that line with a point.
We will then move that line upward, using Graft to see the change.
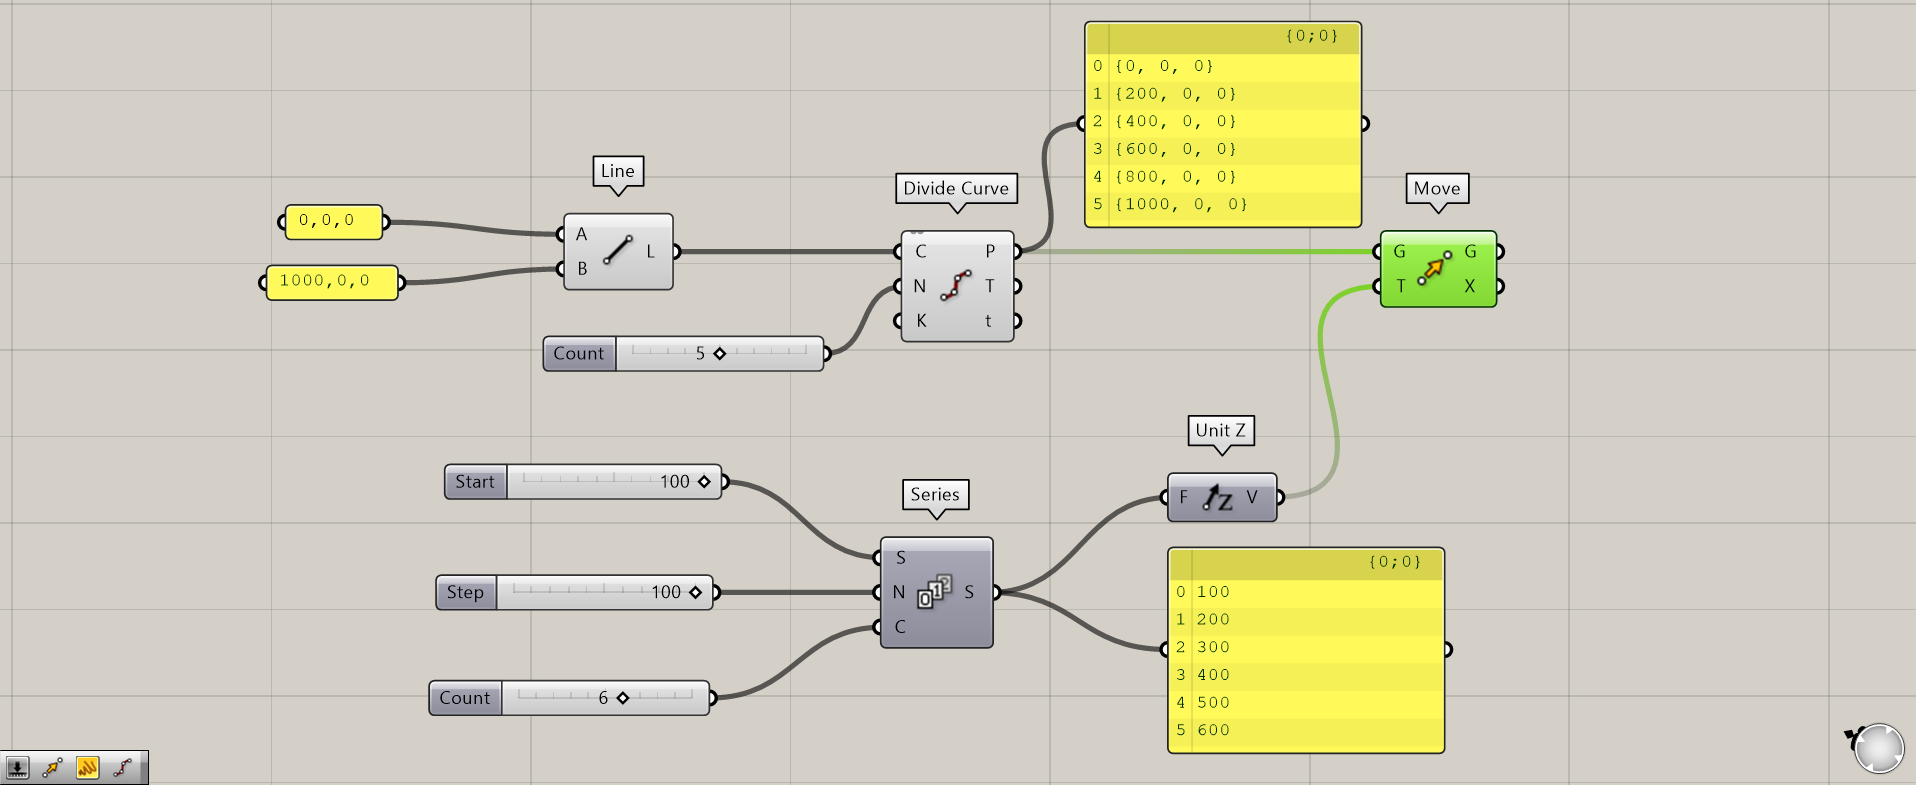
Overall components: (1) Line (2) Divide Curve (3) Series (4) Unit Z (5) Move
First, let’s look at the case where Graft is not set.
Input coordinates to the Line(A and B) and create a line connecting the coordinates.
This time, the coordinates are set to 0,0,0 and 1000,0,0.
Then, using Divide Curve, divide the line at the points.
Enter the number of divisions in the Divide Curve(N).
This time. 5 is entered as the number of divisions, so 6 points are created to divide the line into 5 lines.
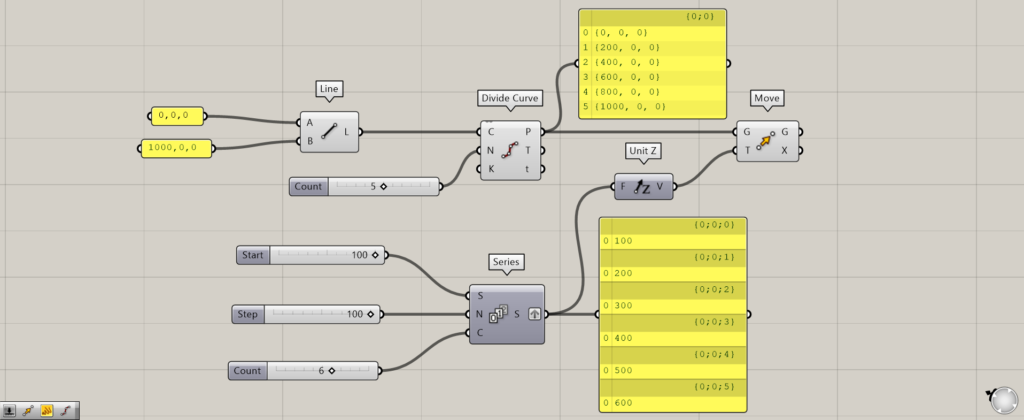
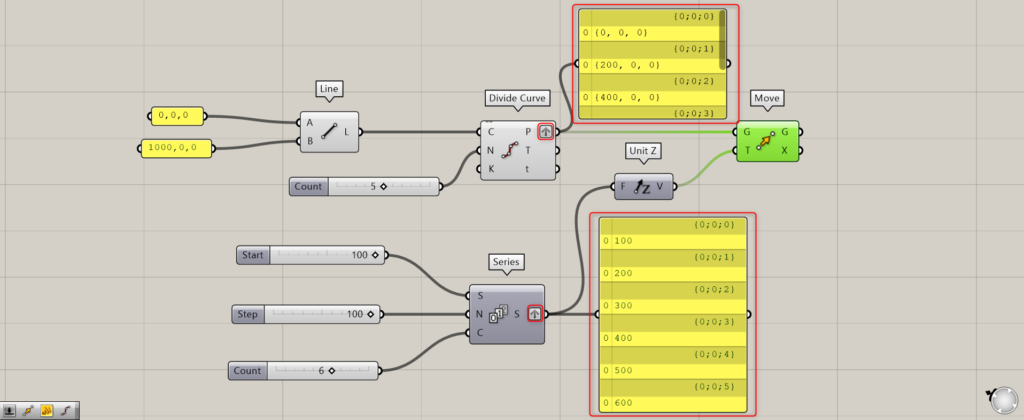
Then, connect 100 to the Series(S), 100 also to the Series(N), and 6 to the Series(C).
This creates six numbers, starting with the number 100 and increasing by 100.
Thus, the Series outputs the numbers 100, 200, 300, 400, 500, and 600.
The Series is then connected to Unit Z, giving a vector in the direction directly above.
Finally, the Move(G) is connected to the Divide Curve(P), and Unit Z is connected to the Move(T).
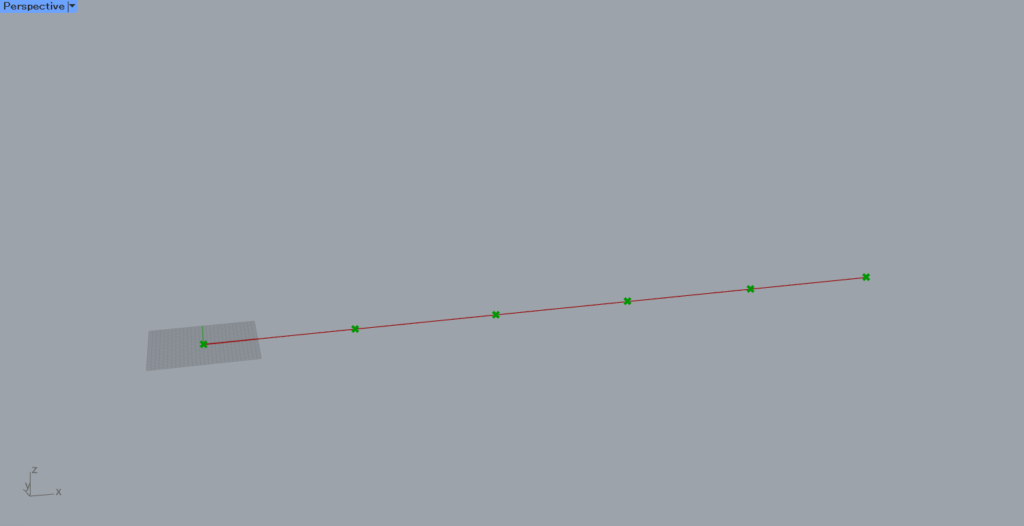
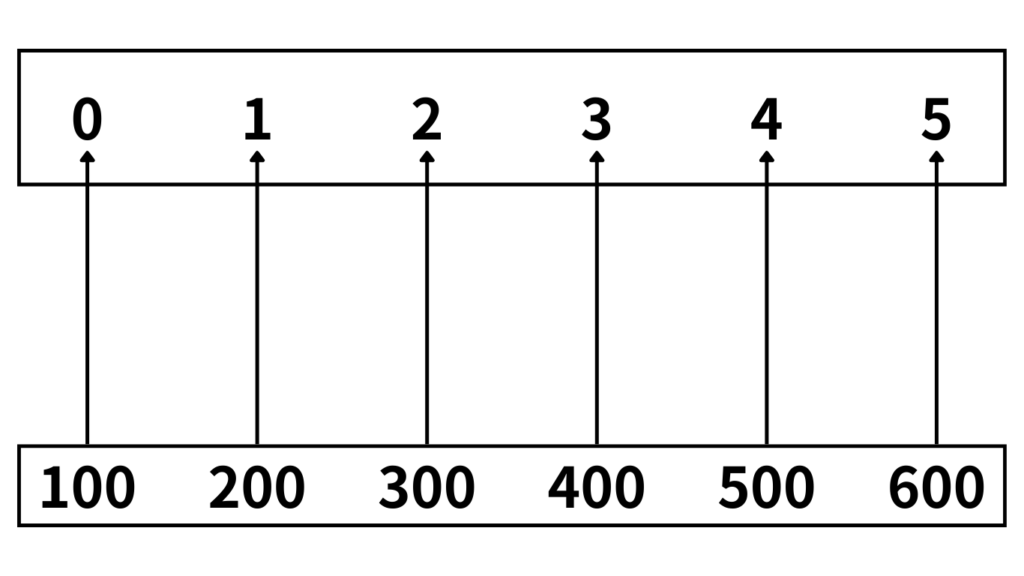
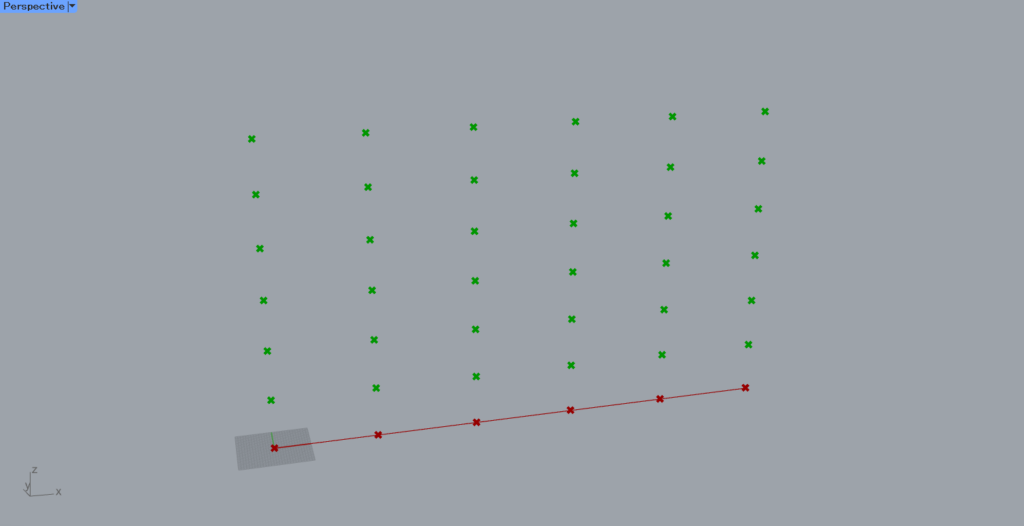
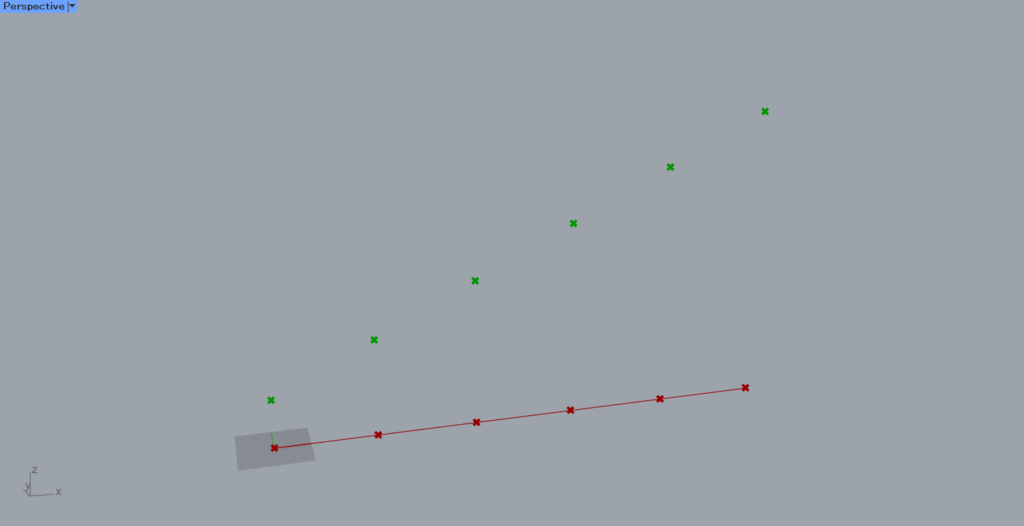
As you can see in the image above, before grafting, each point has been moved upward by one.
Let’s look at the data structure as a box.
Before grafting, there are six data points and six height values in one box.
This is two box types. (both Flatten type)
In this case, one height value is reflected only on points at the same location (same index number).
In this case, point 0 reflects 100, point 1 reflects 200, point 4 reflects 500, and so on.
Therefore, each point is moved one at a time in an upward staircase-like fashion.
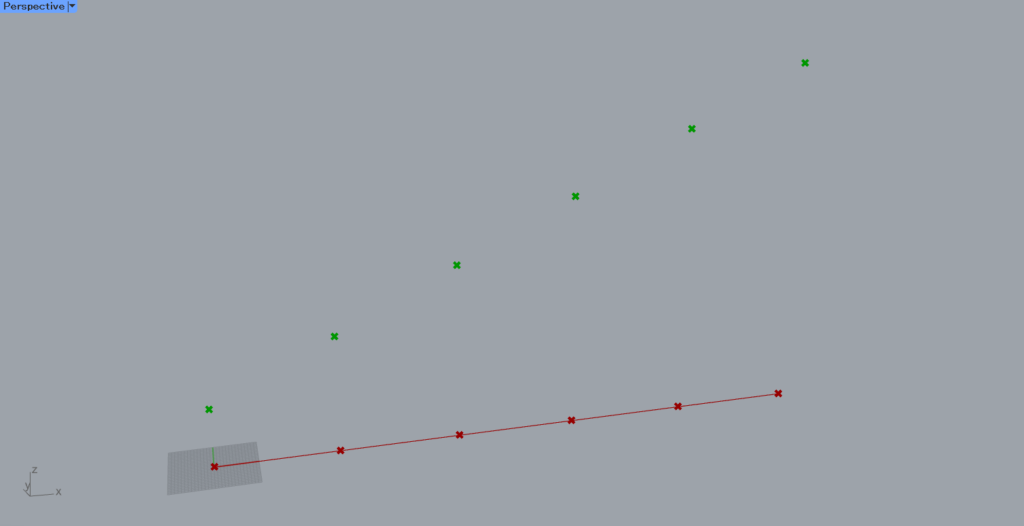
Now let’s look at the Graft setting.
This time, Graft is set to the Series(S).
As you can see, all six points are created and moved upward.
If we look at the data structure as a box, the points are grouped into one box with six points.
On the other hand, when Grafted, the height values have one value in each of the six new boxes.
This is a single box and multiple box type. ( Flatten and Graft types)
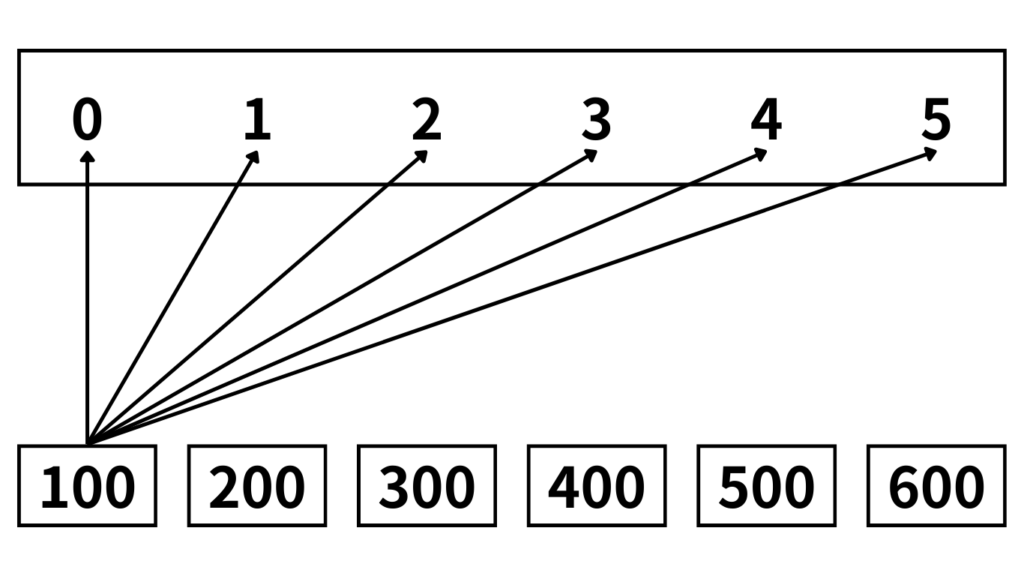
In this case, the height value in one box is reflected in all six points in one box.
Therefore, each height value of 100~600 will be reflected in all the points, as shown in the figure above.
Thus, all six new points are created in the upward direction.
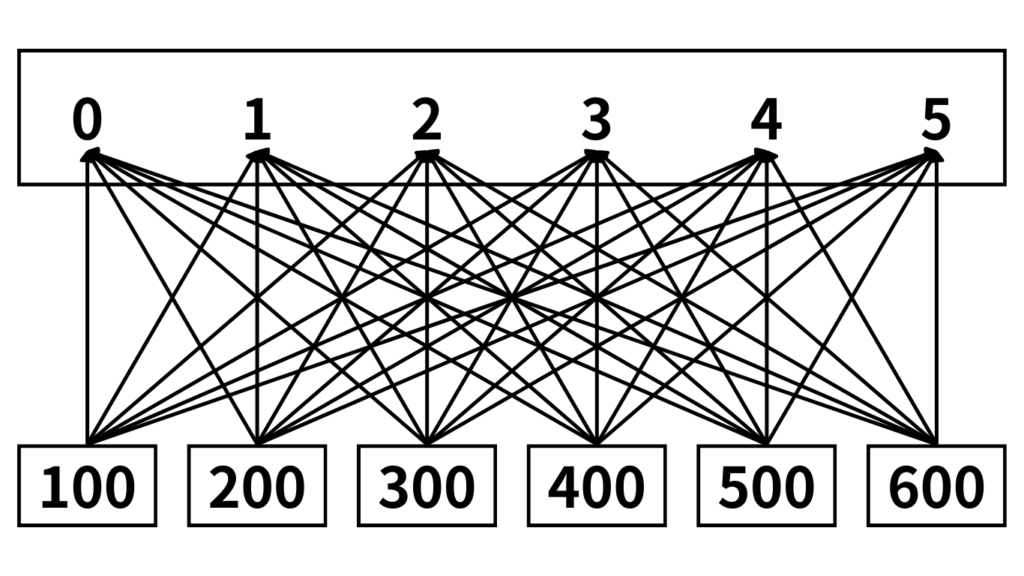
Finally, let’s look at the case where both the point and height data are grafted.
In this case, Graft is set on the Divide Curve(P) and the Series(S).
Then, when both of them were grafted, each point moved upward by one as shown in the image above.
If you look at the data structure as boxes, you can see that the points and height values are grouped into 6 boxes, one for each of the 6 boxes.
This is two sets of multiple box types. (Both are Graft types)
In this case, the effect is assigned only to boxes in the same position.
In this case, 100 is assigned to point 0, 300 to point 2, 500 to point 4, and so on.
This behavior is the same as for the two box types (both Flatten types).
Therefore, in this case also, only one height value is assigned to each point, so only one movement is made for each of them, and they are staircase-like.
List of Grasshopper articles using Graft↓


Comment